Prometheus Explained
To monitor highly dynamic cluster environments like k8s, docker swarm etc. it can also be used for traditional non container infrastructure Prometheus is…


On this page (7)
What is Prometheus? #
To monitor highly dynamic cluster environments like k8s, docker swarm etc. it can also be used for traditional non container infrastructure
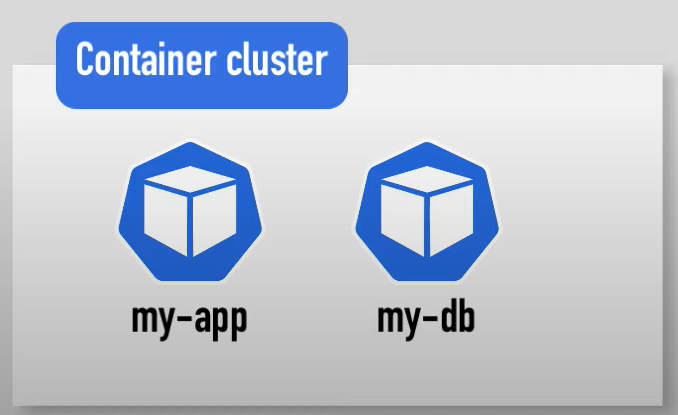
Prometheus is a main stream container and microservice monitoring tool
Where and why is Prometheus used? #
As DevOps is becoming more complex it requires more automation when you have tons of services and applications deployed any one of them can crash and cause failure of other services and suddenly application become unavailable to users
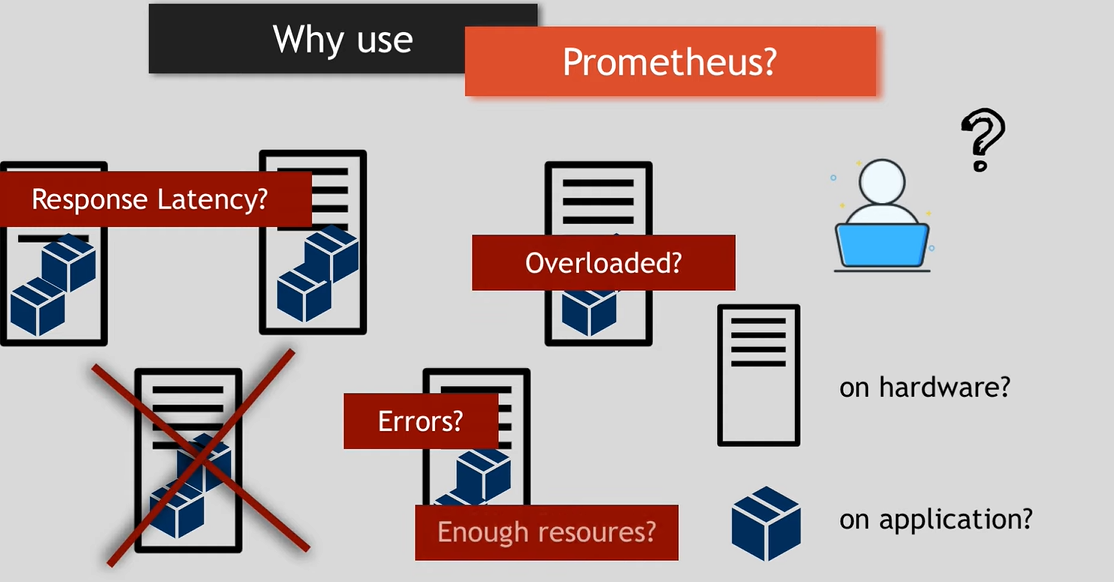
Suppose one specific container ran out of memory and kicked off a container that was responsible for providing database sync between two database pods, that in turn caused the pods to not work properly. Which again was responsible for the Authentication service of the app and the application couldn't authenticate users anymore, but from a user perspective all you can is an error.
How do you know what went wrong internally? #
To prevent we want something that constantly monitors all the services and sends alerts when crashes or identify problems before and sends alerts to the maintainers to prevent such issues for example in our case we can check regular memory usage on each server, if the memory usage goes beyond 70% we can send alerts or If the app gets slow because one service breakdowns.
Prometheus architecture #
Main component Prometheus server-does the actual monitoring work which consist of three parts
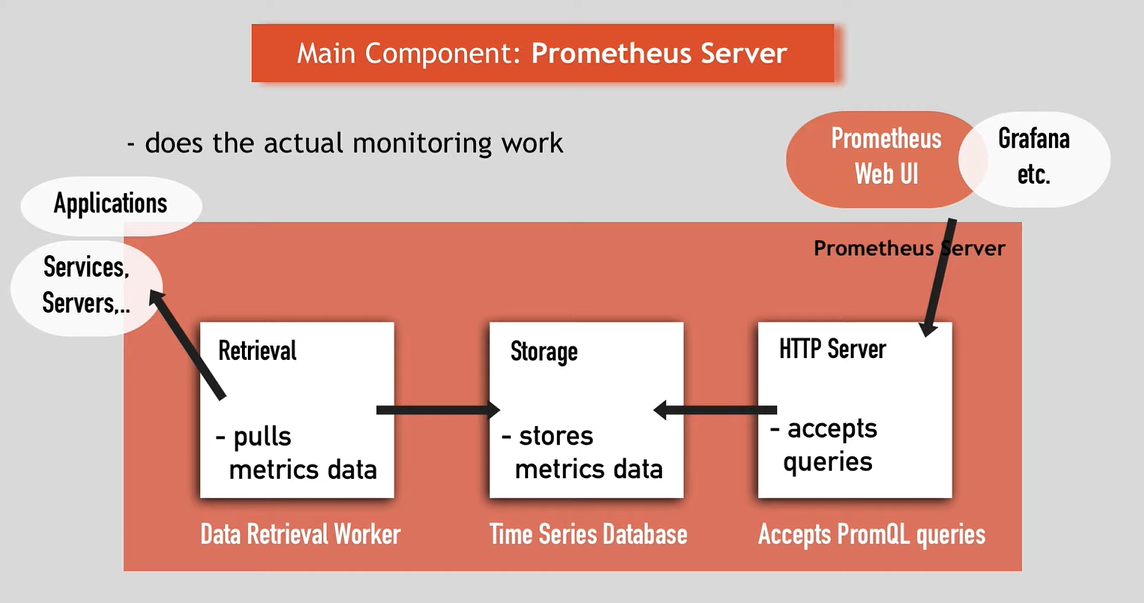
- ** Time series database**(storage) stores all the metric data like : current CPU usage, No. of exceptions per configuration etc.
- Data retrieval worker(retrieval) pulls metric data from applications, servers and storing them or pushing them in database.
- Server or server API ACCEPTS PROMQL queries (HTTP server) from that stored data server API is used to display the data in the form of Prometheus UI/web server either through Prometheus dashboard or Grafana.
What does Prometheus monitor? #
TARGETS AND METRICS
- a) Linux server
- b) Apache server
- c) Single app
- D) Services like database
Prometheus monitor targets every target has some units for Linux server, it could be current CPU status, memory usage, exceptions count.
Units that are monitored from some specific target is called metric and metrics are stored in database component.
metrics:human readable text format metrics entries TYPE and HELP (description of what the metrics is) attributes types:
- a) counter (how many times x happened)
- b) Gauge (what is the current value of x)
- c) Histogram (how long or big?)
How does Prometheus collect those metrics from targets #
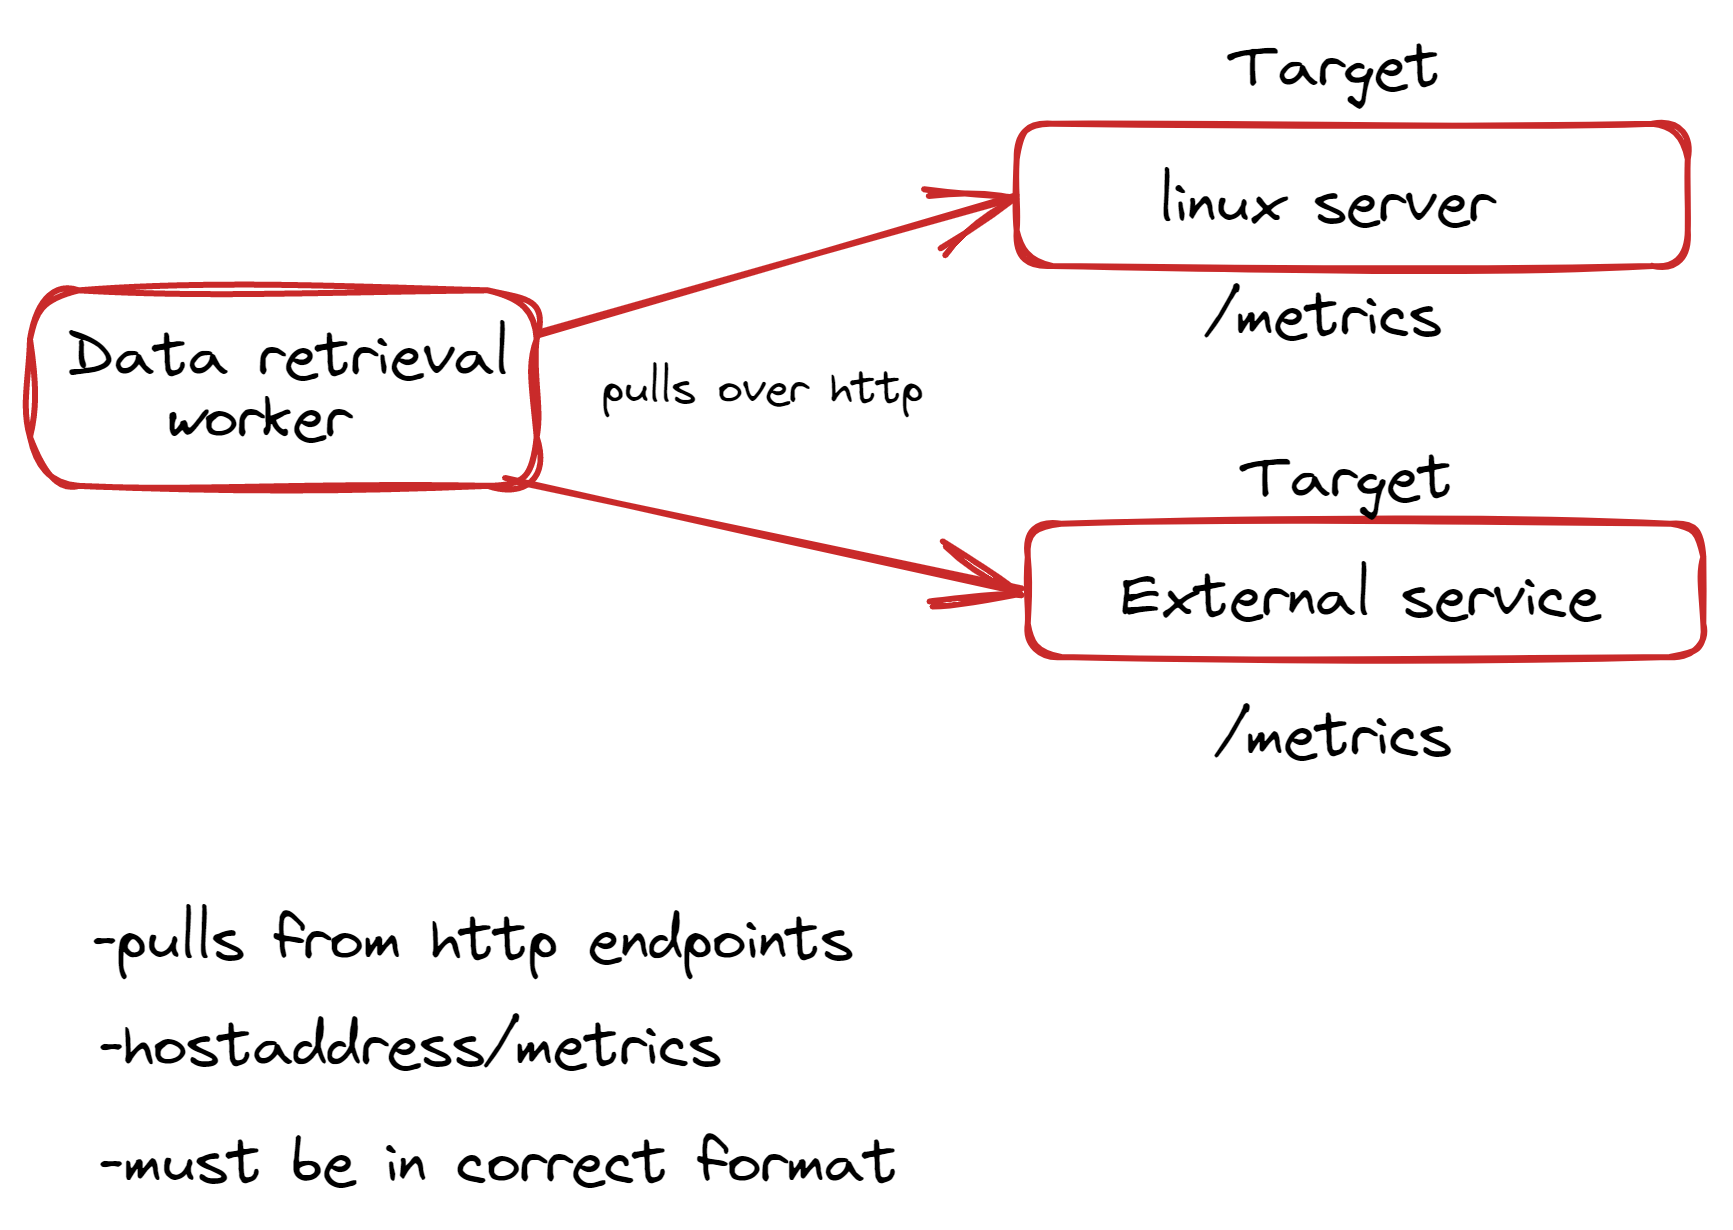 Prometheus pulls metrics data from the targets from an HTTP endpoint, which by default is host address/metrics.
For that to work, one target must expose that /metrics endpoint data available must be in the correct format that Prometheus understands
Target endpoints and exporters #
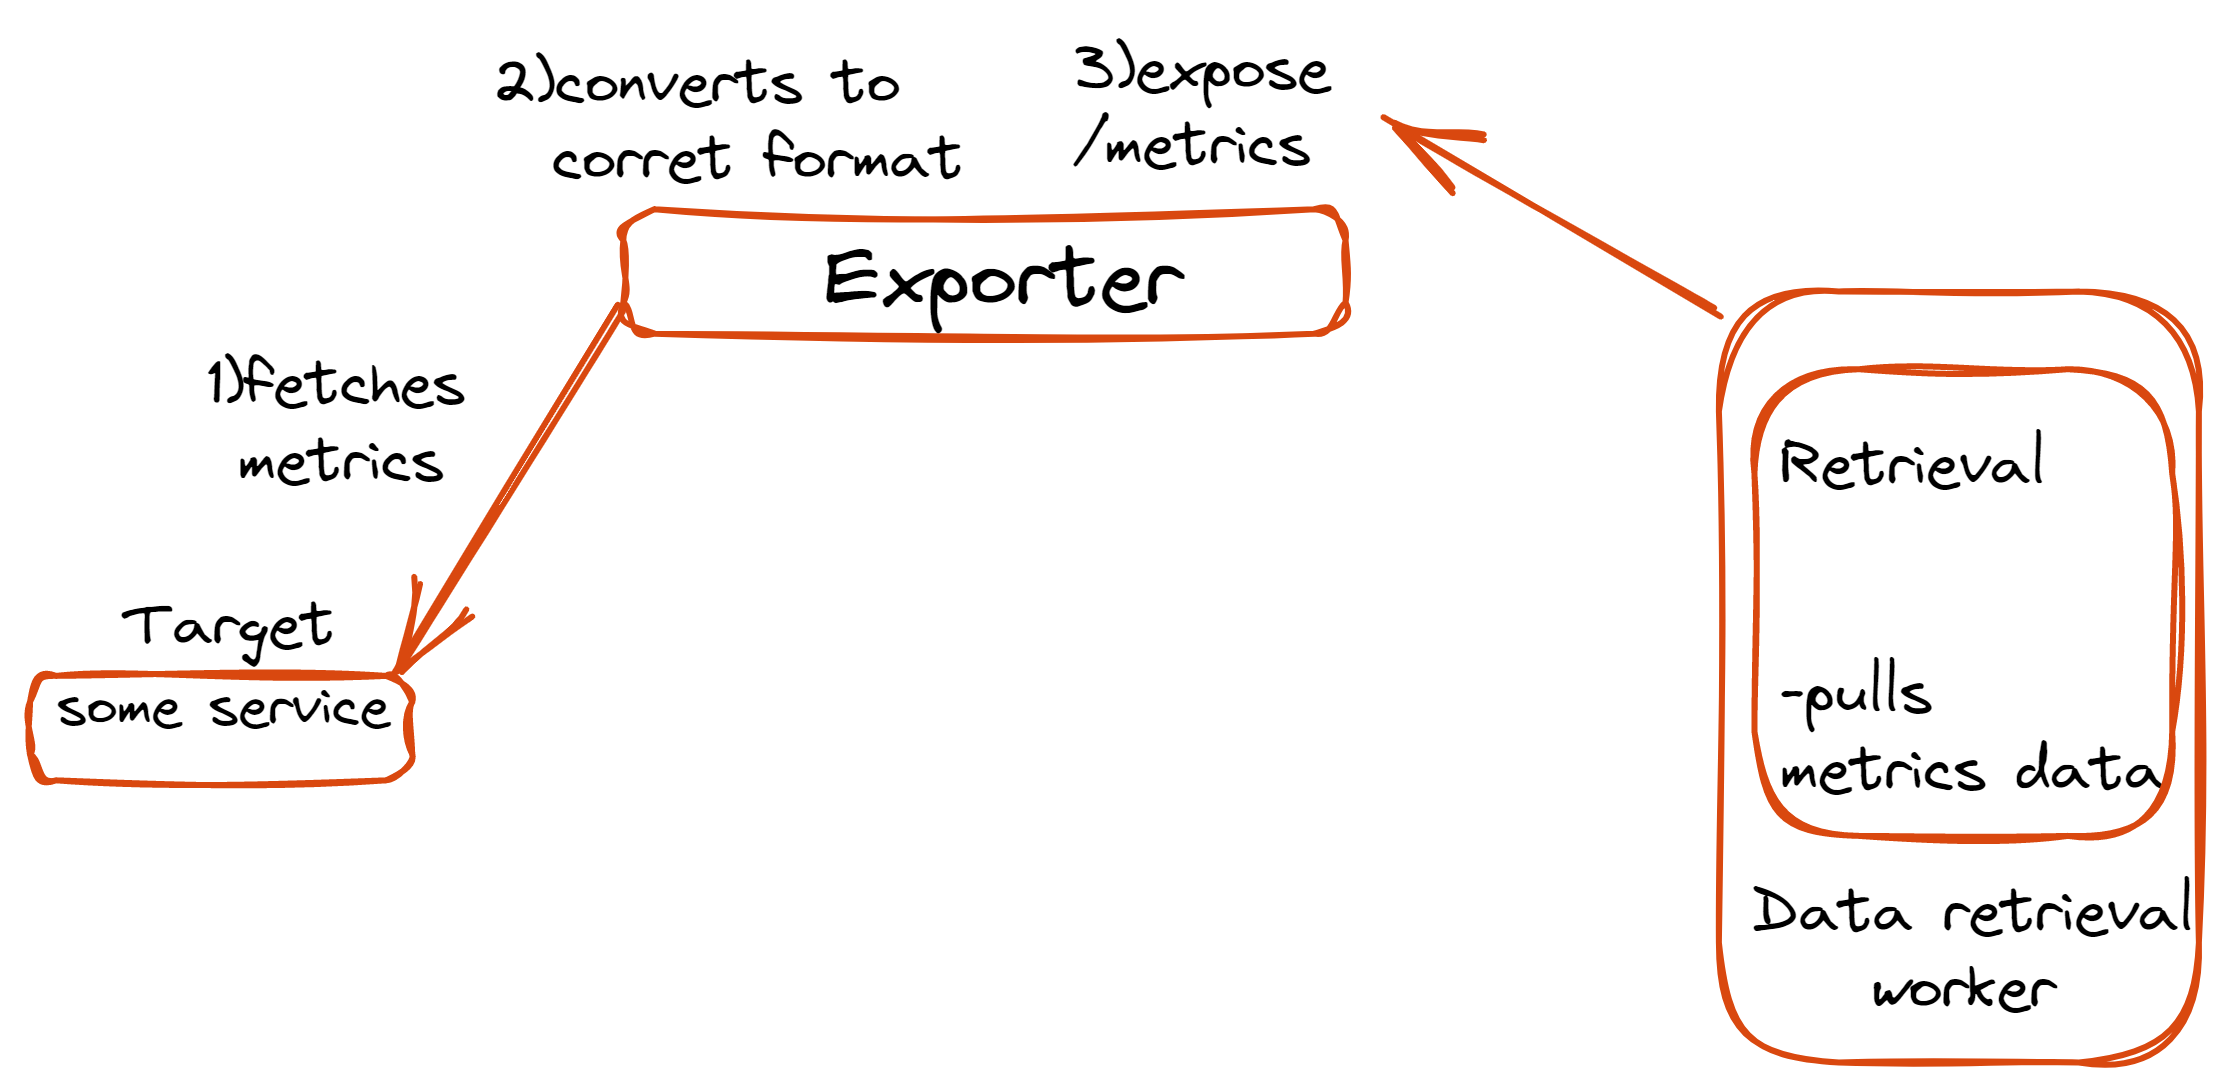
Some servers are already exposing Prometheus endpoints by default, but many services need other components and this component is an exporter.
The exporter is basically a script or service that fetches metrics from your target, converts them to correct format and exposes the metrics where prometheus can scrap them
Prometheus has a list of exporters like MySQL, elastic search, cloud platform and so on you can find some at https://prometheus.io/docs/instrumenting/exporters/ these exporters are also available as docker images
How does Prometheus know what to scrap and when? #
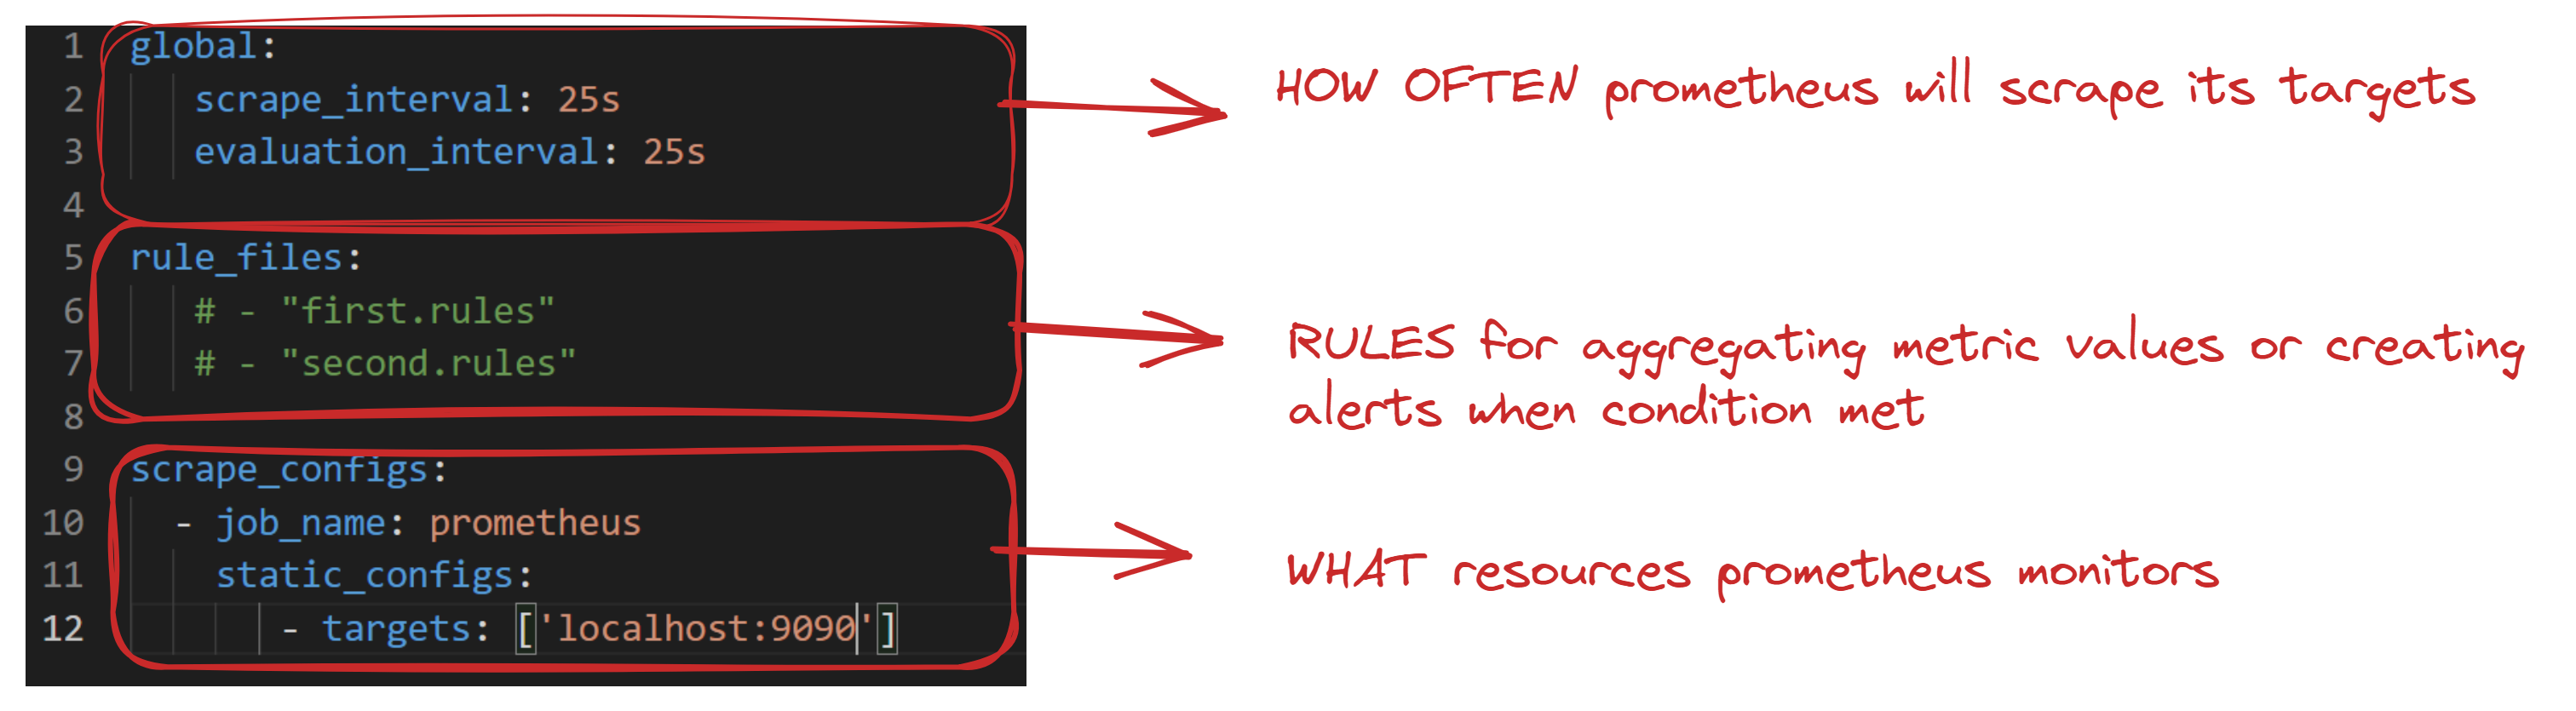
All that is stored in prometheus.yaml file like which targets and at what interval Prometheus uses a service discovery mechanism to find those target endpoints
How does trigger the alerts #
Prometheus has a component called alert manager responsible for firing alerts to different channels like Email or Slack etc. if the condition matches with the alert rule the alerts get fired through that configured channel.
Prometheus stores the data in local disk/HDD data is stored in a custom time-series format.
You can use pro dashboard UI to access the pro server through promQl to query data directly, or you can use more powerful data visualization tools like Grafana etc
Prometheus characteristics #
- Reliable
- Stand alone and self containing
- No extensive setup needed
- less complex
Prometheus with Docker and Kubernetes #
- Fully compatible
- Prometheus components available as docker images
- Can easily be deployed in container Environments like Kubernetes
Conclusion #
Now we have understood the concept of Prometheus and how it is used along with its working, I hope you have gotten the knowledge of Monitoring and why it is necessary. Here's the link to their official page, so do check it out! prometheus
Tech Enuthsiast , Currently learning and implementing DevOps apart from thatI like to make websites and mobile apps , great with desiging and deploying apps
Get new posts in your inbox.
Spotted a typo or want to improve this post? Edit on GitHub →