LLM Costs and Observability with agentgateway on Kubernetes (Part 2)
Part 2: scrape agentgateway with Prometheus, build a Grafana dashboard of token cost and per-tool usage, see blocked tool calls, and alert on spend.

On this page (16)
- Prerequisites
- Why agents need observability, specifically
- The quick look: the metrics endpoint
- The observability architecture
- Step 1: Install Prometheus and Grafana
- Step 2: Make Prometheus scrape the gateway
- Step 3: Generate some agent traffic
- Step 4: Confirm the metric in Prometheus
- Step 5: Import the cost dashboard
- The panels and the PromQL behind them
- Turning tokens into dollars
- See the blocked tool call on the dashboard
- Why you see 405s, and why they are not blocked tools
- Alert on spend
- Common Issues and How to Solve Them
- Conclusion
This is Part 2 of a two-part series. In Part 1 you put a Google ADK agent behind agentgateway on Kubernetes: the agent holds zero secrets, its model and tool calls flow through one proxy, and a policy blocks any tool you have not allowed. That is the governance half. This part is the question governance cannot answer on its own: what is all of this actually costing you, and can you see when an agent misbehaves?
By the end you will have Prometheus and Grafana on the same kind cluster, a dashboard that shows token throughput and an estimated dollar figure as your agents run, and blocked tool-call attempts visible on the same screen.
All the manifests and the dashboard JSON are in the companion repo: https://github.com/shkatara/agentgateway-security-observability
What you'll build in Part 2:
- Prometheus and Grafana running in the cluster via
kube-prometheus-stack. - A
PodMonitorthat scrapes the gateway proxy's metrics. - A Grafana dashboard with token cost, per-tool call counts, and HTTP status, imported from a single file.
- A view of blocked tool-call attempts, and an explanation of why the
405s you will see are not blocked tools. - A
PrometheusRulethat alerts when estimated daily spend crosses a budget.
Note: agentgateway is a fast-moving project. These commands target the
v1.2.xcharts and theagentgateway.dev/v1alpha1API. Pin versions and expect metric names and fields to evolve.
Prerequisites #
You need the setup from Part 1 up and running:
- The
kindcluster with the agentgateway control plane and proxy. - The LLM route (
/v1) and the MCP route (/mcp-github), with the ADK agent working. - Ideally the
AgentgatewayPolicyfrom Part 1 applied (allow onlyget_me), so blocked attempts show up on the dashboard. helmv3.8+ and the port-forward onlocalhost:8080still available.
Why agents need observability, specifically #
Two of the three questions from Part 1 are observability questions. Who spent the money, and on which model? When an agent goes off the rails, where is the trace? A normal service dashboard does not answer these, because it does not understand tokens or tool calls. agentgateway does. It counts tokens and MCP calls for every request and exposes them as Prometheus metrics, so the answers become PromQL queries instead of a shrug.
The quick look: the metrics endpoint #
Before installing anything, confirm the gateway is already emitting what we need. Port-forward the proxy's metrics port and read it:
kubectl port-forward deployment/agentgateway-proxy -n agentgateway-system 15020 &
curl -s localhost:15020/metrics | grep gen_ai_client_token_usageYou will see the token-usage histogram that powers all cost tracking:
agentgateway_gen_ai_client_token_usage_sum{gen_ai_operation_name="chat",gen_ai_request_model="gpt-4o-mini",gen_ai_system="openai",gen_ai_token_type="input"} 342
agentgateway_gen_ai_client_token_usage_count{gen_ai_operation_name="chat",gen_ai_request_model="gpt-4o-mini",gen_ai_system="openai",gen_ai_token_type="input"} 5The labels (gen_ai_request_model, gen_ai_system, gen_ai_token_type) are what let you slice spend by model, provider, and direction. The metrics endpoint is fine for a peek. The payoff is a dashboard, so let us wire one up.
The observability architecture #
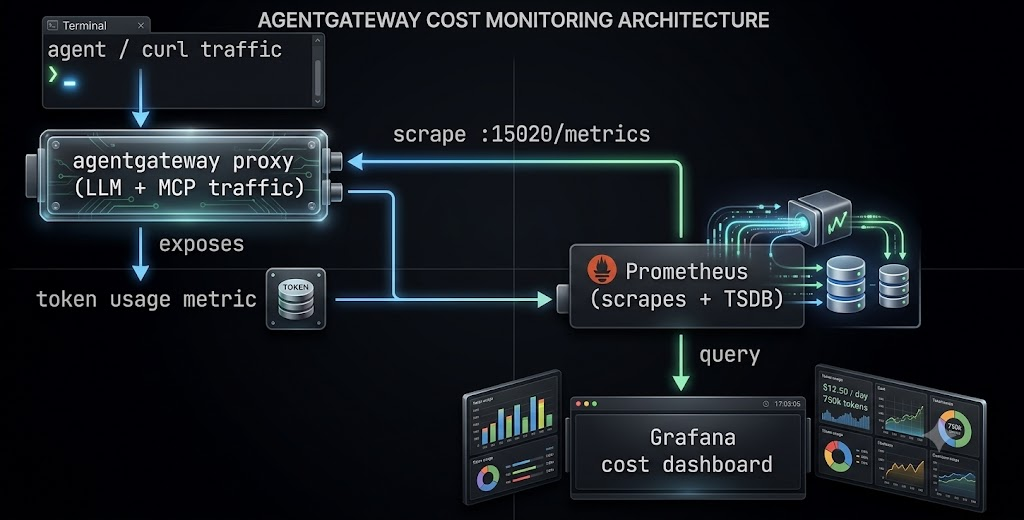
Everything stays inside the same cluster. The proxy exposes metrics on port 15020. We add Prometheus to scrape it and Grafana to draw it.
Step 1: Install Prometheus and Grafana #
The kube-prometheus-stack chart bundles Prometheus, Grafana, the Prometheus Operator, and a Grafana sidecar that auto-loads dashboards from labeled ConfigMaps. The three NilUsesHelmValues=false flags matter. Without them, the operator only picks up PodMonitor and PrometheusRule resources that carry its own release label, and the ones we create next would be silently ignored.
helm upgrade --install kube-prometheus-stack kube-prometheus-stack \
  --repo https://prometheus-community.github.io/helm-charts \
  --namespace telemetry --create-namespace \
  --set prometheus.prometheusSpec.podMonitorSelectorNilUsesHelmValues=false \
  --set prometheus.prometheusSpec.serviceMonitorSelectorNilUsesHelmValues=false \
  --set prometheus.prometheusSpec.ruleSelectorNilUsesHelmValues=false \
--waitIt pulls a few images, so give it a minute. Confirm the stack is up:
kubectl get pods -n telemetryStep 2: Make Prometheus scrape the gateway #
First, find the label that uniquely identifies the proxy pod. This one step saves the most debugging time.
kubectl get pods -n agentgateway-system --show-labels | grep proxyagentgateway's own scrape config keys on kgateway=kube-gateway for data plane proxies, which is what the PodMonitor below uses. If your output shows a different label (for example app.kubernetes.io/name=agentgateway-proxy), use that in the selector.
kubectl apply -f- <<EOF
apiVersion: monitoring.coreos.com/v1
kind: PodMonitor
metadata:
  name: agentgateway-proxy
  namespace: agentgateway-system
  labels:
    release: kube-prometheus-stack
spec:
  namespaceSelector:
    matchNames:
      - agentgateway-system
  selector:
    matchLabels:
      app.kubernetes.io/name: agentgateway-proxy
  podMetricsEndpoints:
    - targetPort: 15020
      path: /metrics
      interval: 15s
EOFConfirm Prometheus picked up the target. Port-forward Prometheus, open http://localhost:9090/targets, and look for podMonitor/agentgateway-system/agentgateway-proxy in the UP state.
kubectl port-forward -n telemetry svc/kube-prometheus-stack-prometheus 9090Step 3: Generate some agent traffic #
A dashboard with no traffic is a flat line. Keep the 8080 port-forward from Part 1 running, then send a burst of LLM calls through the gateway:
for i in $(seq 1 50); do
  curl -s "localhost:8080/v1/chat/completions" \
    -H content-type:application/json \
    -d '{"model":"gpt-4o-mini","messages":[{"role":"user","content":"Give me one random fact in a single sentence."}]}' \
    > /dev/null
  echo "request $i sent"
  sleep 2
doneYou can also just chat with the ADK agent a few more times. Either way, every call increments the token metric.
Step 4: Confirm the metric in Prometheus #
Before touching Grafana, confirm the data landed. With the port-forward on 9090, open http://localhost:9090/graph and run:
agentgateway_gen_ai_client_token_usage_sumYou should see series with labels like gen_ai_request_model="gpt-4o-mini" and gen_ai_token_type="input". If they are here, Grafana is just drawing what Prometheus already has.
Step 5: Import the cost dashboard #
The dashboard ships as agentgateway-cost-dashboard.json in the repo. The Grafana sidecar auto-imports any ConfigMap in the telemetry namespace labeled grafana_dashboard=1, so from the repo root:
kubectl -n telemetry create configmap agentgateway-cost-dashboard \
  --from-file=agentgateway-cost-dashboard.json
kubectl -n telemetry label configmap agentgateway-cost-dashboard grafana_dashboard=1Port-forward Grafana and log in:
kubectl port-forward -n telemetry deployment/kube-prometheus-stack-grafana 3000 &
# username: admin
kubectl -n telemetry get secret kube-prometheus-stack-grafana -o jsonpath='{.data.admin-password}' | base64 -dOpen the agentgateway: Agent LLM Cost and Usage dashboard. With the traffic loop running, the panels fill in within a scrape interval or two.
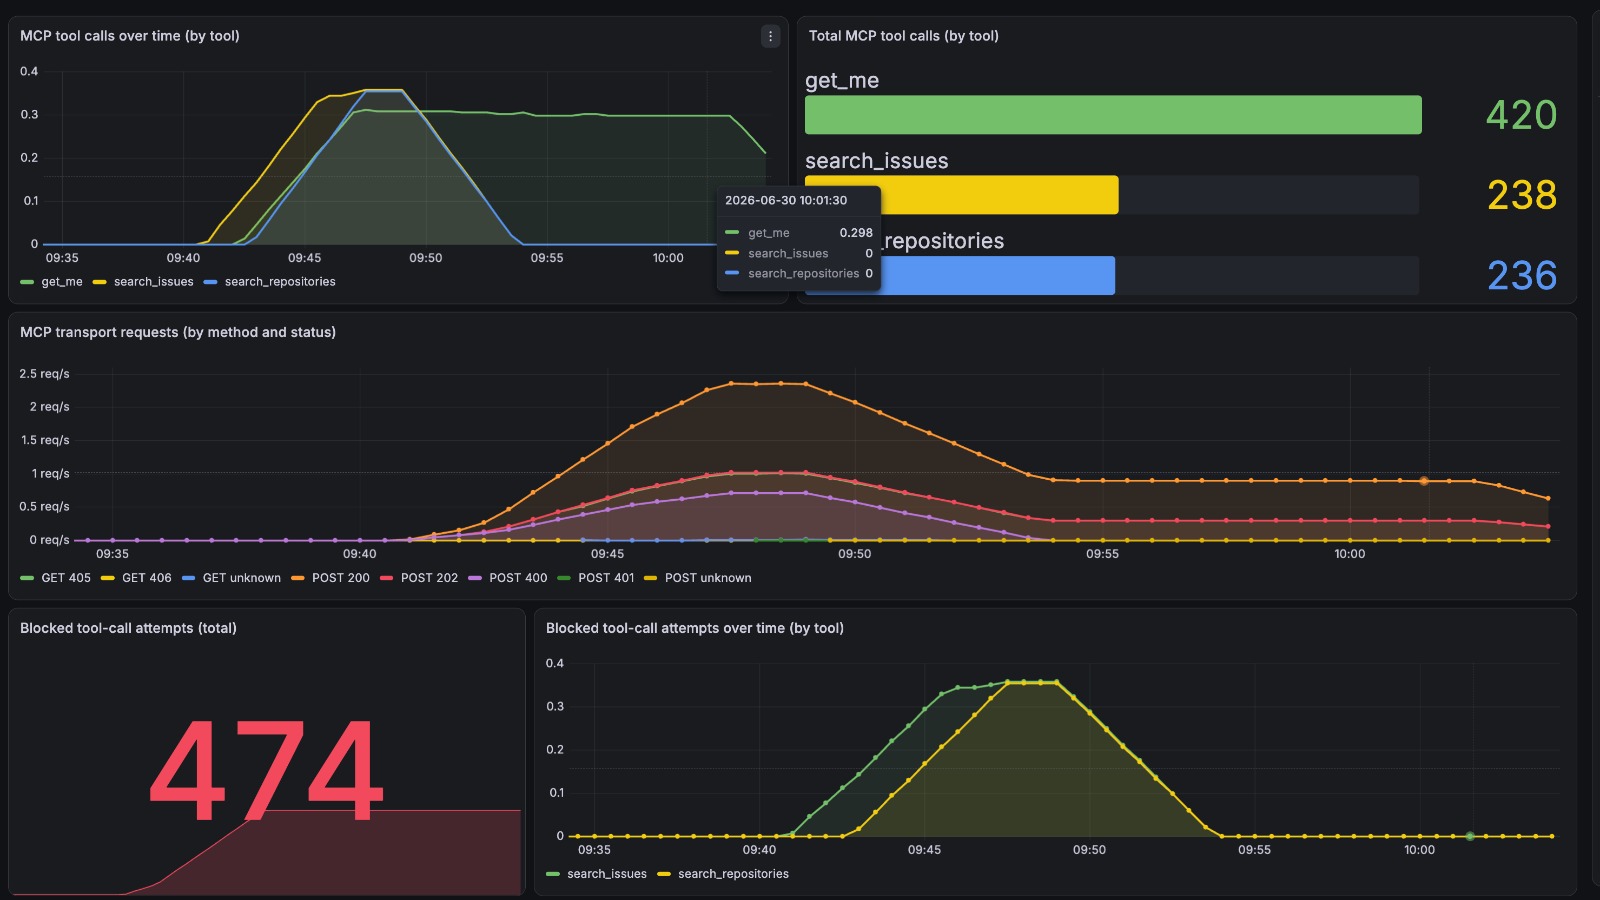
Top row: MCP tool calls over time, and totals per tool. Middle: MCP transport HTTP by method and status, where the GET 405/406 lines are normal transport negotiation, not blocked tools (more on that below). Bottom: blocked tool-call attempts, everything outside the allow-list.
The panels and the PromQL behind them #
If you would rather build the dashboard by hand, or you just want to understand what each panel asks Prometheus, here is every query.
| Panel | What it shows | PromQL |
|---|---|---|
| Token throughput (input vs output) | Tokens per second, split by direction | sum by (gen_ai_token_type) (rate(agentgateway_gen_ai_client_token_usage_sum[5m])) |
| Token throughput by model | Which models are burning tokens | sum by (gen_ai_request_model) (rate(agentgateway_gen_ai_client_token_usage_sum[5m])) |
| Estimated spend (last 1h) | A live dollar figure | (sum(increase(agentgateway_gen_ai_client_token_usage_sum{gen_ai_token_type="input"}[1h])) / 1000000) * 0.15 + (sum(increase(agentgateway_gen_ai_client_token_usage_sum{gen_ai_token_type="output"}[1h])) / 1000000) * 0.60 |
| LLM requests per second by status | HTTP status of LLM-route traffic only | sum by (status) (rate(agentgateway_requests_total{route="agentgateway-system/openai"}[5m])) |
| MCP transport requests (by method and status) | Raw HTTP on the MCP route | sum by (method, status) (rate(agentgateway_requests_total{route="agentgateway-system/mcp-github"}[5m])) |
| MCP tool calls over time (by tool) | Which tools are being called | sum by (resource) (rate(agentgateway_mcp_requests_total{method="tools/call"}[5m])) |
| Total MCP tool calls (by tool) | How many times each tool was called | sum by (resource) (agentgateway_mcp_requests_total{method="tools/call"}) |
| Blocked tool-call attempts (total) | Calls to tools outside the allow-list | sum(agentgateway_mcp_requests_total{method="tools/call", resource!="get_me"}) |
| Blocked tool-call attempts over time (by tool) | When and which blocked tools were attempted | sum by (resource) (rate(agentgateway_mcp_requests_total{method="tools/call", resource!="get_me"}[5m])) |
A note on the MCP metric. Tool activity is agentgateway_mcp_requests_total, with a method label (tools/list, tools/call, initialize) and, for tool calls, a resource label holding the tool name. So ...{method="tools/call", resource="get_me"} is the per-tool call count. The gateway counts the attempt even when a tool is blocked, so a tool you have hidden by policy still shows a count here. The metric records that a call was attempted, not whether it was allowed, so the proxy logs are where you confirm the verdict. If names differ on your build, run curl -s localhost:15020/metrics | grep mcp.
Turning tokens into dollars #
There is no magic in the spend panel. It multiplies token counts by your provider's price:
cost = (input_tokens / 1,000,000 × input_price) + (output_tokens / 1,000,000 × output_price)The dashboard keeps the two prices in hidden variables (price_in, price_out), defaulting to example values for a small model. Prices change and vary by model, so treat them as placeholders and set your real rates in the dashboard's Variables settings. The increase(...[1h]) window means the stat reads as spend over the last hour.
See the blocked tool call on the dashboard #
This is where the two halves of the series meet. When you applied the AgentgatewayPolicy that allows only get_me, every attempt to call another tool is rejected. With the dashboard open, run a handful of blocked calls:
for i in $(seq 1 5); do
  npx @modelcontextprotocol/inspector@0.21.2 \
    --cli http://localhost:8080/mcp-github \
    --transport http \
    --method tools/call \
    --tool-name search_repositories \
    --tool-arg query="kubernetes"
  sleep 1
doneEach one comes back as Unknown tool, because the policy hides search_repositories. Even so, the gateway records the attempt, so search_repositories shows up on the per-tool panels with its own count, and on the "blocked tool-call attempts" panels because it is not in the allow-list. A blocked tool with a rising count is a useful signal in itself: something is trying to reach a tool it is not allowed to.
Why you see 405s, and why they are not blocked tools #
Look at the MCP transport panel and you will see a lot of GET 405 and GET 406. It is tempting to read those as blocked tools. They are not.
A blocked tool call returns HTTP 200 with a JSON-RPC error in the body (Unknown tool).
MCP errors are application-level, not HTTP status codes, so blocking never shows up as a 4xx. The 405 and 406 responses are MCP Streamable HTTP transport: the client issues a GET to open an SSE stream, or a DELETE to end a session, and that method is not allowed on the endpoint. It is normal protocol negotiation.
That is exactly why the dashboard scopes the LLM status panel to the OpenAI route and gives the MCP route its own transport panel. Otherwise the MCP transport noise leaks into your LLM error rate and you chase a problem that is not there.
Alert on spend #
You do not want to watch a dashboard all day. A PrometheusRule fires when estimated daily spend crosses a threshold. The release: kube-prometheus-stack label is what makes the operator pick the rule up.
kubectl apply -f- <<EOF
apiVersion: monitoring.coreos.com/v1
kind: PrometheusRule
metadata:
  name: agentgateway-cost-alerts
  namespace: telemetry
  labels:
    release: kube-prometheus-stack
spec:
  groups:
    - name: llm_cost
      rules:
        - alert: HighDailyLLMSpend
          expr: |
            (
              (sum(increase(agentgateway_gen_ai_client_token_usage_sum{gen_ai_token_type="input"}[24h])) / 1000000) * 0.15 +
              (sum(increase(agentgateway_gen_ai_client_token_usage_sum{gen_ai_token_type="output"}[24h])) / 1000000) * 0.60
            ) > 50
          for: 5m
          labels:
            severity: warning
          annotations:
            summary: "Estimated LLM spend over the last 24h exceeded 50 USD"
EOFAdjust the prices and the > 50 threshold to your budget. The alert appears in Prometheus under Alerts, and routes through AlertManager if you have wired up a receiver.
Common Issues and How to Solve Them #
| Symptom | Likely cause | Fix |
|---|---|---|
Proxy target missing or DOWN in Prometheus | The PodMonitor selector does not match the proxy pod, or the operator ignores the monitor | Run kubectl get pods -n agentgateway-system --show-labels and fix the selector; confirm the podMonitorSelectorNilUsesHelmValues=false flag |
Target UP but no agentgateway_gen_ai_* series | No LLM traffic yet, or the wrong port | Run the traffic loop and confirm metrics on :15020/metrics |
| Grafana panels say "datasource not found" | The dashboard datasource variable did not auto-select | Pick Prometheus from the datasource dropdown at the top of the dashboard |
| Dashboard never appears in Grafana | The ConfigMap is unlabeled or in the wrong namespace | It must be in the telemetry namespace and labeled grafana_dashboard=1 |
| Estimated spend shows 0 | increase() needs at least two samples in the window | Send traffic and wait a couple of scrape intervals |
| MCP panels are empty | The tool-call metric is named differently on your build | Run `curl -s localhost:15020/metrics |
A lot of GET 405/406 on the MCP route | Normal MCP Streamable HTTP transport negotiation, not blocked tools | Nothing to fix; blocked tools are HTTP 200 with Unknown tool in the body |
Conclusion #
That completes the series. In Part 1 you made agents safe to run: no secrets in the runtime, and tools locked down by policy. In Part 2 you made them legible: token cost per model on a live graph, per-tool usage, blocked attempts you can watch, and an alert when spend runs away.
Here's what you accomplished in Part 2:
- Installed Prometheus and Grafana on the same cluster as the gateway.
- Scraped the proxy with a
PodMonitorand verified the target. - Imported a cost dashboard showing token throughput, per-model usage, per-tool calls, and an estimated dollar figure.
- Made blocked tool-call attempts visible, and learned why the
405s are transport noise, not policy denials. - Added an alert that fires when estimated daily spend crosses a budget.
Put together, the two parts answer the questions you could not answer before: who spent what, who can call which tool, and where the trace is. That single control point is the difference between a pile of agents and a platform.
All the manifests, the agent, and the dashboard are in the repo: https://github.com/shkatara/agentgateway-security-observability. The agentgateway project lives at agentgateway.dev.
Building Hybrid K8s Platforms @trivago | Tech Author & Speaker (freeCodeCamp, SREDays) | vCluster Ambassador | RHCA & GCP DevOps Professional
Get new posts in your inbox.
Spotted a typo or want to improve this post? Edit on GitHub →