Running Nemotron 3.5 Lightning on DGX Spark
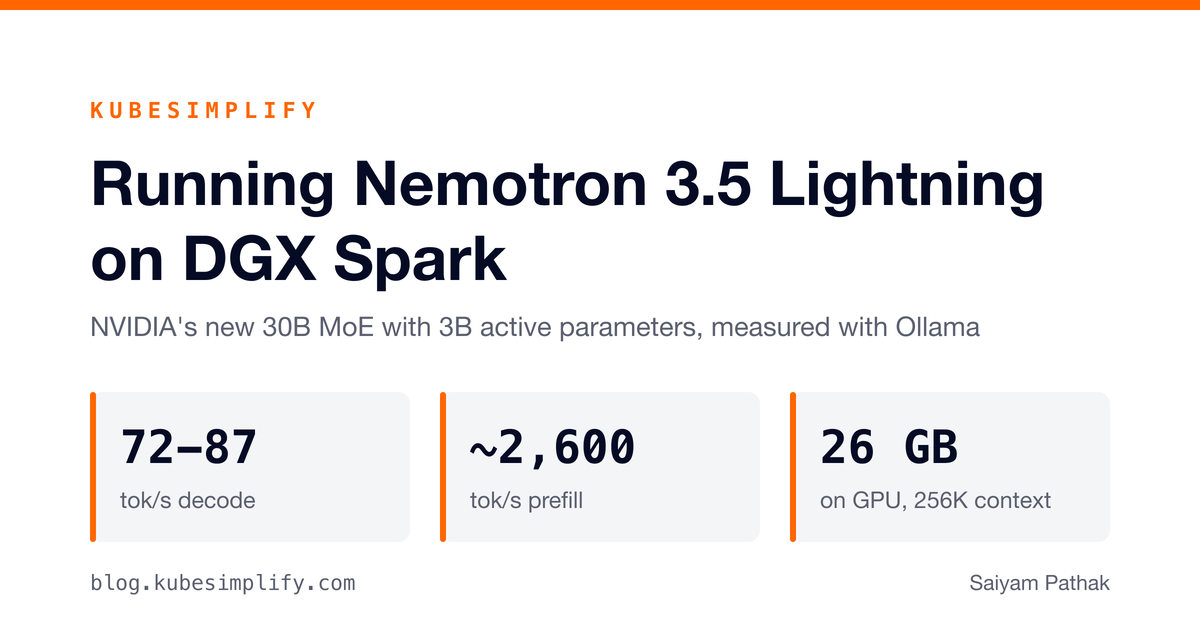
NVIDIA's new Nemotron 3.5 Lightning on DGX Spark: how to run it with Ollama and vLLM, the tokens per second I measured, and how the two paths compare.
New to the jargon? Every term, flag, and benchmark number here is explained in plain English in the local LLM glossary.
On this page (8)
NVIDIA released Nemotron 3.5 Lightning today (August 11, 2026), and the pitch is simple: long-running agents spend most of their tokens on boring execution work (tool calls, validating outputs, formatting results), and you should not be burning frontier-model money on that. Lightning is the small, fast worker model for that layer.
NVIDIA specifically calls out DGX Spark as a deployment target. I have a Spark on my desk. So instead of quoting their charts, I pulled the model the hour it landed and measured it myself. This is a short post with what I measured, and one gotcha you should know about if you try it right away.
What it actually is #
The specs, verified against the model config on Hugging Face, not the press release:
| Spec | Value |
|---|---|
| Total parameters | 30B |
| Active parameters | ~3B per token |
| Architecture | Hybrid Mamba-Transformer MoE (nemotron_h), 52 layers |
| Experts | 128 routed, 6 active per token, plus 1 shared expert |
| Context window | Up to 1M tokens (the HF config defaults to 256K, sized for single-GPU deployment) |
| Pre-training | Over 20T tokens, with an NVFP4 pre-training recipe |
| Speculative decoding | MTP layer baked in, plus separate DSpark and DFlash draft models on HF |
| Checkpoints | BF16 and NVFP4 |
| License | OpenMDW-1.1 (weights, data, and recipes released) |
The family resemblance to Nemotron 3 Super and Ultra is deliberate. Same hybrid Mamba-Transformer MoE recipe, same multi-token prediction training, just shrunk to a size where 3B active parameters means memory bandwidth stops being your enemy. On a bandwidth-bound box like the Spark (273 GB/s), the active parameter count is what decides your decode speed. That is the reason this model exists at this size.
NVIDIA's own positioning worth repeating: on PinchBench it scores 86% while completing 10,000 tasks about 30% faster than Qwen3.6 35B at similar accuracy (their blog says 30%, the launch tweet says 35%, I am going with the blog). They also claim up to 4x the output speed of similar-sized models. Those are NVIDIA's numbers, mine are below.
The gotcha: your Ollama is too old #
Ollama is a day-one launch partner, and the model is already in the library. But:
$ ollama pull nemotron-3.5-lightning:30b-a3b
Error: pull model manifest: 412:
The model you are attempting to pull requires a newer version of Ollama.Support for the Nemotron 3.5 architecture landed in Ollama v0.32.9, released today, a few hours after the model itself. Anything older fails with that 412, and on launch day "older" included both my Spark's install (0.30.10) and the ollama/ollama:latest Docker image (still 0.32.6 when I tried it). The fix is to upgrade, then pull again.
curl -fsSL https://ollama.com/install.sh | sh
ollama pull nemotron-3.5-lightning:30b-a3b
ollama run nemotron-3.5-lightning:30b-a3bBy the time you read this, a plain upgrade is probably all you need. I mention it because if you searched that 412 error, this is why.
25GB download. The Ollama build is a Q4_K_M GGUF that ollama show reports as 32.9B parameters (the gap vs the marketing 30B is likely the MTP layer and embeddings being counted). Two things worth noticing in the model metadata: it ships with draft_num_predict 2, meaning Ollama is already using the baked-in multi-token prediction for speculative decoding out of the box, and it lists tools and thinking capabilities. Keep in mind this is not the NVFP4 checkpoint. More on that at the end.
The numbers #
All runs on my DGX Spark (GB10, 128GB unified memory, DGX OS), Ollama 0.32.9, temperature 0, measured via the API so the tok/s figures come from Ollama's own eval counters, 3 runs each.
First, the footprint. Cold load took 27.3 seconds, and ollama ps reports 26GB resident at 100% GPU. Interesting detail: Ollama loads this model with the full 262,144 token context window by default, and even at 256K context the whole thing plus KV cache room fits with roughly 86GB of the unified pool still available. On a 24GB card you would be making painful tradeoffs; here it just loads.
NAME                              SIZE     PROCESSOR    CONTEXT
nemotron-3.5-lightning:30b-a3b 26 GB 100% GPU 262144The throughput numbers:
| Test | Prefill (uncached) | Decode |
|---|---|---|
| Short prompt (39 tok), 500 token generation | small prompt, not meaningful | 71.7 to 73.0 tok/s |
| 8,194 token prompt, 200 token generation | 2,583 tok/s | 85 to 87 tok/s |
| 15,820 token prompt (cache-busted rerun) | 2,655 tok/s | 83.9 tok/s |
| Agent-style prompt (tool call JSON) | 85.6 to 86.7 tok/s |
And the raw runs behind that table, straight from the API counters (repeat runs of the same long prompt hit Ollama's prompt cache, which is why I only count uncached first passes for prefill):
short run 1: prompt 39 tok @ 87.6 tok/s   | decode 500 tok @ 73.01 tok/s
short run 2: prompt 39 tok @ 918.5 tok/s  | decode 500 tok @ 71.90 tok/s
short run 3: prompt 39 tok @ 824.5 tok/s  | decode 500 tok @ 71.73 tok/s
long  run 1: prompt 8194 tok @ 2583.4 tok/s | decode 200 tok @ 38.36 tok/s (first-load outlier)
long  run 2: prompt cached                  | decode 200 tok @ 86.97 tok/s
long  run 3: prompt cached                  | decode 200 tok @ 85.38 tok/s
cache-busted: prompt 15820 tok @ 2654.7 tok/s | decode 200 tok @ 83.93 tok/s
agent run 1: decode 150 tok @ 85.62 tok/s
agent run 2: decode 150 tok @ 86.17 tok/s
agent run 3: decode 150 tok @ 85.94 tok/sSo: roughly 72 to 87 tok/s single-stream decode and about 2,600 tok/s prefill, sustained even with 8K to 16K tokens of context on the clock. An 8K-token prompt is fully ingested in just over 3 seconds. The one 38 tok/s decode reading happened immediately after the model's very first prefill and never reproduced; the cache-busted rerun confirms decode stays in the 80s with a fresh 15K-token prefill.
Two things surprised me:
Decode speed depends on what the model is generating. The short test (YAML plus prose) sat at 72 tok/s while the log-summary and JSON tool-call tests ran 84 to 87 tok/s. My best explanation is the built-in speculative decoding: the Ollama build ships with draft_num_predict 2, so the MTP head drafts ahead and predictable output (JSON, repetitive summaries) gets a higher acceptance rate than free-form prose. So the tok/s you get depends on the workload.
Agent-style calls come back fast. I gave it a tool-calling prompt (find why an nginx deployment is CrashLooping, respond with the next tool call as JSON). It reasoned for a few hundred tokens, then returned exactly this, end to end in 5.9 seconds:
{
  "tool": "run_command",
  "parameters": {
    "cmd": "kubectl get pods -n web"
  }
}That is the right first step, and it came back as clean JSON with nothing extra around it. This is a reasoning model by default (Ollama reports the thinking capability), so budget for a couple hundred thinking tokens per call, at 86 tok/s that is about 3 seconds of overhead per agent step.
How it compares with other models on the same box #
I first reached for the numbers I measured back in May and the comparison looked flattering. Then I reran everything today, on the same Ollama 0.32.9 server, same prompt, same settings, and the picture changed. (Note: NVIDIA's PinchBench comparison is against Qwen3.6 35B; what I have locally is its predecessor, qwen3.5:35b-a3b, so treat these as class comparisons, not a re-run of NVIDIA's benchmark.)
| Model | Active params | Decode tok/s (today) | My May number |
|---|---|---|---|
| Nemotron 3.5 Lightning 30B-A3B | ~3B | 71.7 to 73.0 (prose), 84 to 87 (JSON, summaries) | n/a, launched today |
| qwen3.5:35b-a3b | ~3B | 78.1 | 52.7 |
| gemma4:26b (26B-A4B MoE) | ~4B | 66.2 | 58.0 |
| nemotron-3-super (120B-A12B) | ~12B | 21.8 | 17.7 |
The first thing this table shows has nothing to do with Nemotron: the runtime itself got faster. Qwen3.5 35B-A3B went from 52.7 to 78.1 tok/s on the same hardware since May, because Ollama now exploits its MTP head for speculative decoding too. If you are still quoting tok/s numbers from a months-old Ollama, they are stale. Mine were.
The second thing: through Ollama, raw decode speed against Qwen3.5 35B-A3B is basically a tie. On the identical prose prompt, Qwen was actually a touch faster (78 vs 72). NVIDIA's "up to 4x the output speed of similar-sized models" comes from the Artificial Analysis leaderboard, measuring hosted NVFP4 endpoints with the full draft-model stack; you do not see that 4x through Ollama today. Against its own big brother Nemotron 3 Super, the model it is meant to take execution work from, Lightning is a real 3.3x to 4x.
Where Lightning does win is token efficiency. I gave qwen3.5:35b-a3b the exact CrashLoop agent prompt from earlier, temperature 0. Both models produced the identical correct kubectl get pods -n web tool call:
| Tokens to answer | Wall clock | |
|---|---|---|
| Nemotron 3.5 Lightning | 485 | 5.9s |
| qwen3.5:35b-a3b | 1,953 | 26.0s |
Qwen thought four times longer to reach the same place. One prompt is not a benchmark, but it is exactly the behavior NVIDIA claims Lightning was trained for: their PinchBench pitch is 30% faster task completion at similar accuracy, a time-to-done argument rather than a tok/s argument. On this one task the agent step finished 4.4x sooner. For an agent doing thousands of steps a day, tokens per step matters more than tokens per second.
Update: the NVFP4 checkpoint with vLLM and DSpark #
The Ollama numbers above are the Q4_K_M GGUF. NVIDIA's recommended path for the Spark is different: the NVFP4 checkpoint served by vLLM with the DSpark draft model doing speculative decoding. The exact recipe is on the NVFP4 model card, and it runs in the stock vllm/vllm-openai:v0.27.1 image, no special Spark build needed:
docker run -d --name vllm-lightning --gpus all --ipc=host --network=host \
  -v $HOME/.cache/huggingface:/root/.cache/huggingface \
  vllm/vllm-openai:v0.27.1 \
  --model nvidia/NVIDIA-Nemotron-3.5-Lightning-30B-A3B-NVFP4 \
  --served-model-name nemotron-3.5-lightning \
  --moe-backend marlin \
  --kv-cache-dtype fp8 \
  --max-model-len 65536 \
  --enable-prefix-caching \
  --speculative_config.method dspark \
  --speculative_config.model nvidia/NVIDIA-Nemotron-3.5-Lightning-30B-A3B-NVFP4-DSpark \
  --speculative_config.num_speculative_tokens 3 \
  --mamba-backend flashinfer \
  --mamba-cache-mode align \
  --gpu-memory-utilization 0.80 \
  --reasoning-parser nemotron_v3 \
  --tool-call-parser qwen3_coder \
--enable-auto-tool-choiceOne note on NVIDIA's recipe: it sets --gpu-memory-utilization 0.91, which on this box allocates 88GB of KV cache. I tested both. 0.91 starts and runs fine on this stack, and decodes at the same speed, but it leaves about 1GB of free system memory on a machine where CPU and GPU share the pool. I ran the benchmarks at 0.80: identical single-stream decode, 75GB of KV cache, and 12GB of headroom. The bigger allocation only buys you more concurrent requests, so if the Spark is doing anything else at all, 0.80 is the safer number (weights are 21.5GB, engine init took just under 2 minutes).
Same prompts, same method as the Ollama tests:
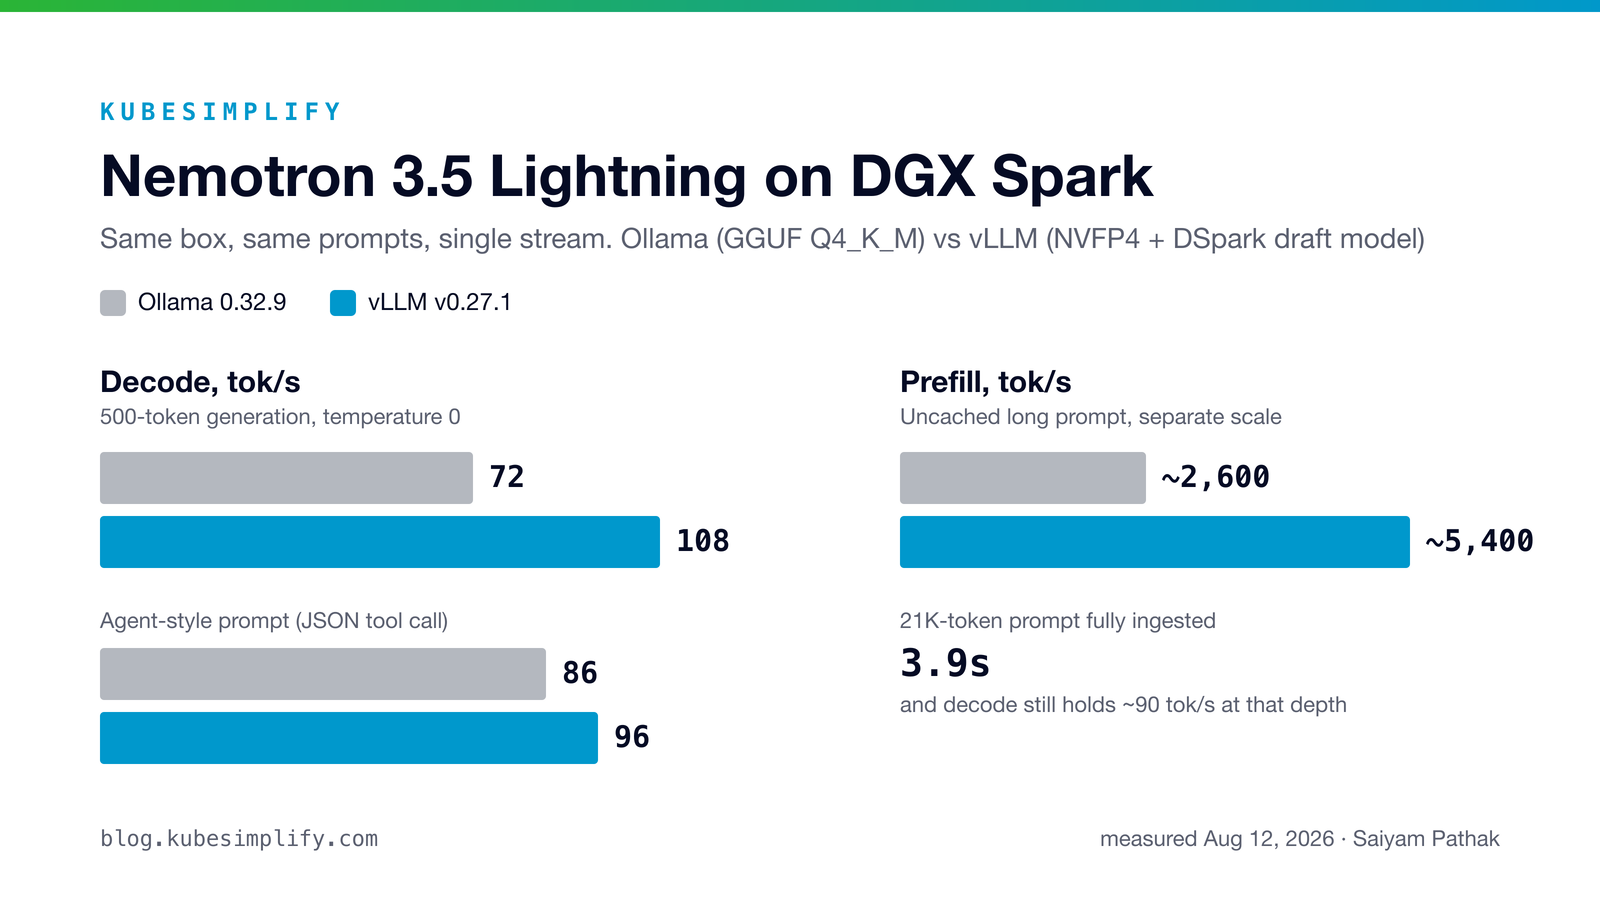
| Test | Ollama (GGUF Q4_K_M) | vLLM (NVFP4 + DSpark) |
|---|---|---|
| Short prompt, 500 token decode | 72 tok/s | 108 tok/s |
| Agent-style prompt, decode | 86 tok/s | 95 to 98 tok/s |
| Long prompt, decode after prefill | 84 to 87 tok/s | 88 to 90 tok/s |
| Prefill, uncached | ~2,600 tok/s | ~5,400 tok/s |
The raw vLLM runs:
short run 1: decode 500 tok @ 108.31 tok/s
short run 2: decode 500 tok @ 108.26 tok/s
short run 3: decode 500 tok @ 108.22 tok/s
long  run 1: prompt 21218 tok, TTFT 3.93s (~5,394 tok/s prefill) | decode @ 89.92 tok/s
agent runs: decode @ 98.28 / 94.31 / 95.90 tok/sSo the recommended path is roughly 1.5x the Ollama decode speed and about 2x the prefill, on the same hardware, and it holds ~90 tok/s with 21K tokens of context on the clock. The DSpark draft model is doing real work here: the one public comparison point, a sibling 30B-A3B NVFP4 on a Spark without speculative decoding, sits at 57 tok/s.
One tuning note before someone asks: there are configs circulating that set 256K context and num_speculative_tokens: 7 instead of 3, some on vLLM nightly builds. I tested the draft depth both ways on both the release image and a current nightly, four combinations total. Depth 3 gives about 108 tok/s single stream on the release image and on EXO's exact nightly alike; depth 7 gives 80 to 93 on both. The mechanics: every verification pass pays for all drafted tokens whether or not they get accepted, and on these prompts the acceptance rate at depth 7 does not cover the extra cost. EXO's numbers come from an 884-task agentic suite where longer contexts may shift that tradeoff, but for single-stream use on this box, 3 is the number I would run.
Two smaller things this test surfaced. First, my "8,194 token prompt" in the Ollama runs was actually Ollama silently truncating a much longer prompt to fit its context setting; vLLM processed the full 21,218 tokens. The per-token prefill rates stand, but it is a good reminder to check prompt_eval_count when you benchmark Ollama. Second, these vLLM numbers came through the completions endpoint without the chat template, so the model skipped its long thinking pass on the agent prompt; decode speed is comparable, token counts are not, so I am not re-running the token-efficiency comparison here.
Benchmark it yourself #
The community leaderboard for this box is Spark Arena, and it standardizes on llama-benchy sweeps. To run the same sweep against the server above, raise --max-model-len to 262144 in the serve command so the deeper context points fit, then:
pip install llama-benchy
llama-benchy --base-url http://localhost:8000/v1 --model nemotron-3.5-lightning \
  --depth 0 4096 8192 16384 32768 65535 100000 \
  --pp 2048 --tg 128 --enable-prefix-caching \
--concurrency 1 2 5 10 --save-result results.csvOne reading tip for leaderboard numbers, there or anywhere: check whether a tok/s figure is single-stream or an aggregate peak across concurrent requests. The same recipe that decodes around 110 tok/s for one user can show 230+ tok/s summed over ten parallel streams, and the two numbers answer different questions.
Reality check #
A few things to know before you use these numbers:
- Runtime matters as much as model. The same checkpoint family spans 72 to 108 tok/s on this box depending on how you serve it. Quote numbers with their runtime attached.
- Single stream only. These are one-user interactive numbers. If you want aggregate throughput, that is a vLLM or TensorRT-LLM concurrency story (NVIDIA published deployment guides for both).
- Launch-day software. Ollama support is hours old. Expect the numbers to move as kernels and the runtime settle. I will update if they move meaningfully.
There is one other public number to compare against: the NVIDIA forum benchmark of Nemotron 3 Nano Omni 30B-A3B, an architecturally similar 30B-A3B, at 56.96 tok/s decode on a Spark via vLLM NVFP4 without speculative decoding. A 55 to 60 tok/s baseline for this size class, lifted into the 70s and 80s by MTP drafting, matches what I measured.
Why I care about this model specifically #
The interesting part is not the benchmark table, it is the division of labor NVIDIA is pushing. Alongside Lightning they released NeMo Switchyard, an open source model router: plans go up to a frontier model, execution comes down to Lightning. LangChain measured a 74% cost reduction routing between Lightning and Claude Opus 4.8 with only 7% of calls escalating to the frontier model, at about a 6 point accuracy tradeoff.
A 3B-active model decoding at 108 tok/s on a desktop box fits that execution layer well. The follow-up I want to do next: Lightning on the Spark as the local execution model, a frontier model in the cloud for planning, and Switchyard routing between them. If that sounds interesting, subscribe.
Saiyam is working as Head of DevRel at vCluster Labs. He is the founder of Kubesimplify, focusing on simplifying cloud-native & AI infrastructure. He is KubeCon Co-chair and has worked on many facets of Kubernetes, including machine learning platforms, scaling, multi-cloud, & managed Kubernetes services. When not coding, Saiyam contributes to the community by writing blogs and organizing local meetups for Kubernetes and CNCF. He is also a CNCF TAG OpsRes Chair & can be reached on Twitter @saiyampathak.
Get new posts in your inbox.
Spotted a typo or want to improve this post? Edit on GitHub →