Running Qwen3.8-Flash-Next on a DGX Spark and RTX PRO 6000
Qwen dropped Qwen3.8-Flash-Next this week, and the first thing I saw on my timeline was somebody saying it will not fit on a single DGX Spark. The NVFP4…
New to the jargon? Every term, flag, and benchmark number here is explained in plain English in the local LLM glossary.
On this page (20)
- What the model is
- Why the size question is confusing
- Test environment
- Part 1: the DGX Spark
- llama.cpp support is not merged yet
- Getting the weights
- Running it
- The prefill curve is the interesting bit
- "IQ1S" is not a 1-bit model
- What it costs you
- Part 2: RTX PRO 6000 with vLLM
- How many GPUs do you need?
- What does offloading the N-gram table actually cost?
- Speculative decoding, and why benchmark workload decides the answer
- Does MTP change the answer?
- One card, with NVFP4
- Both machines side by side
- What I did not measure
- Thanks
- Wrapping up
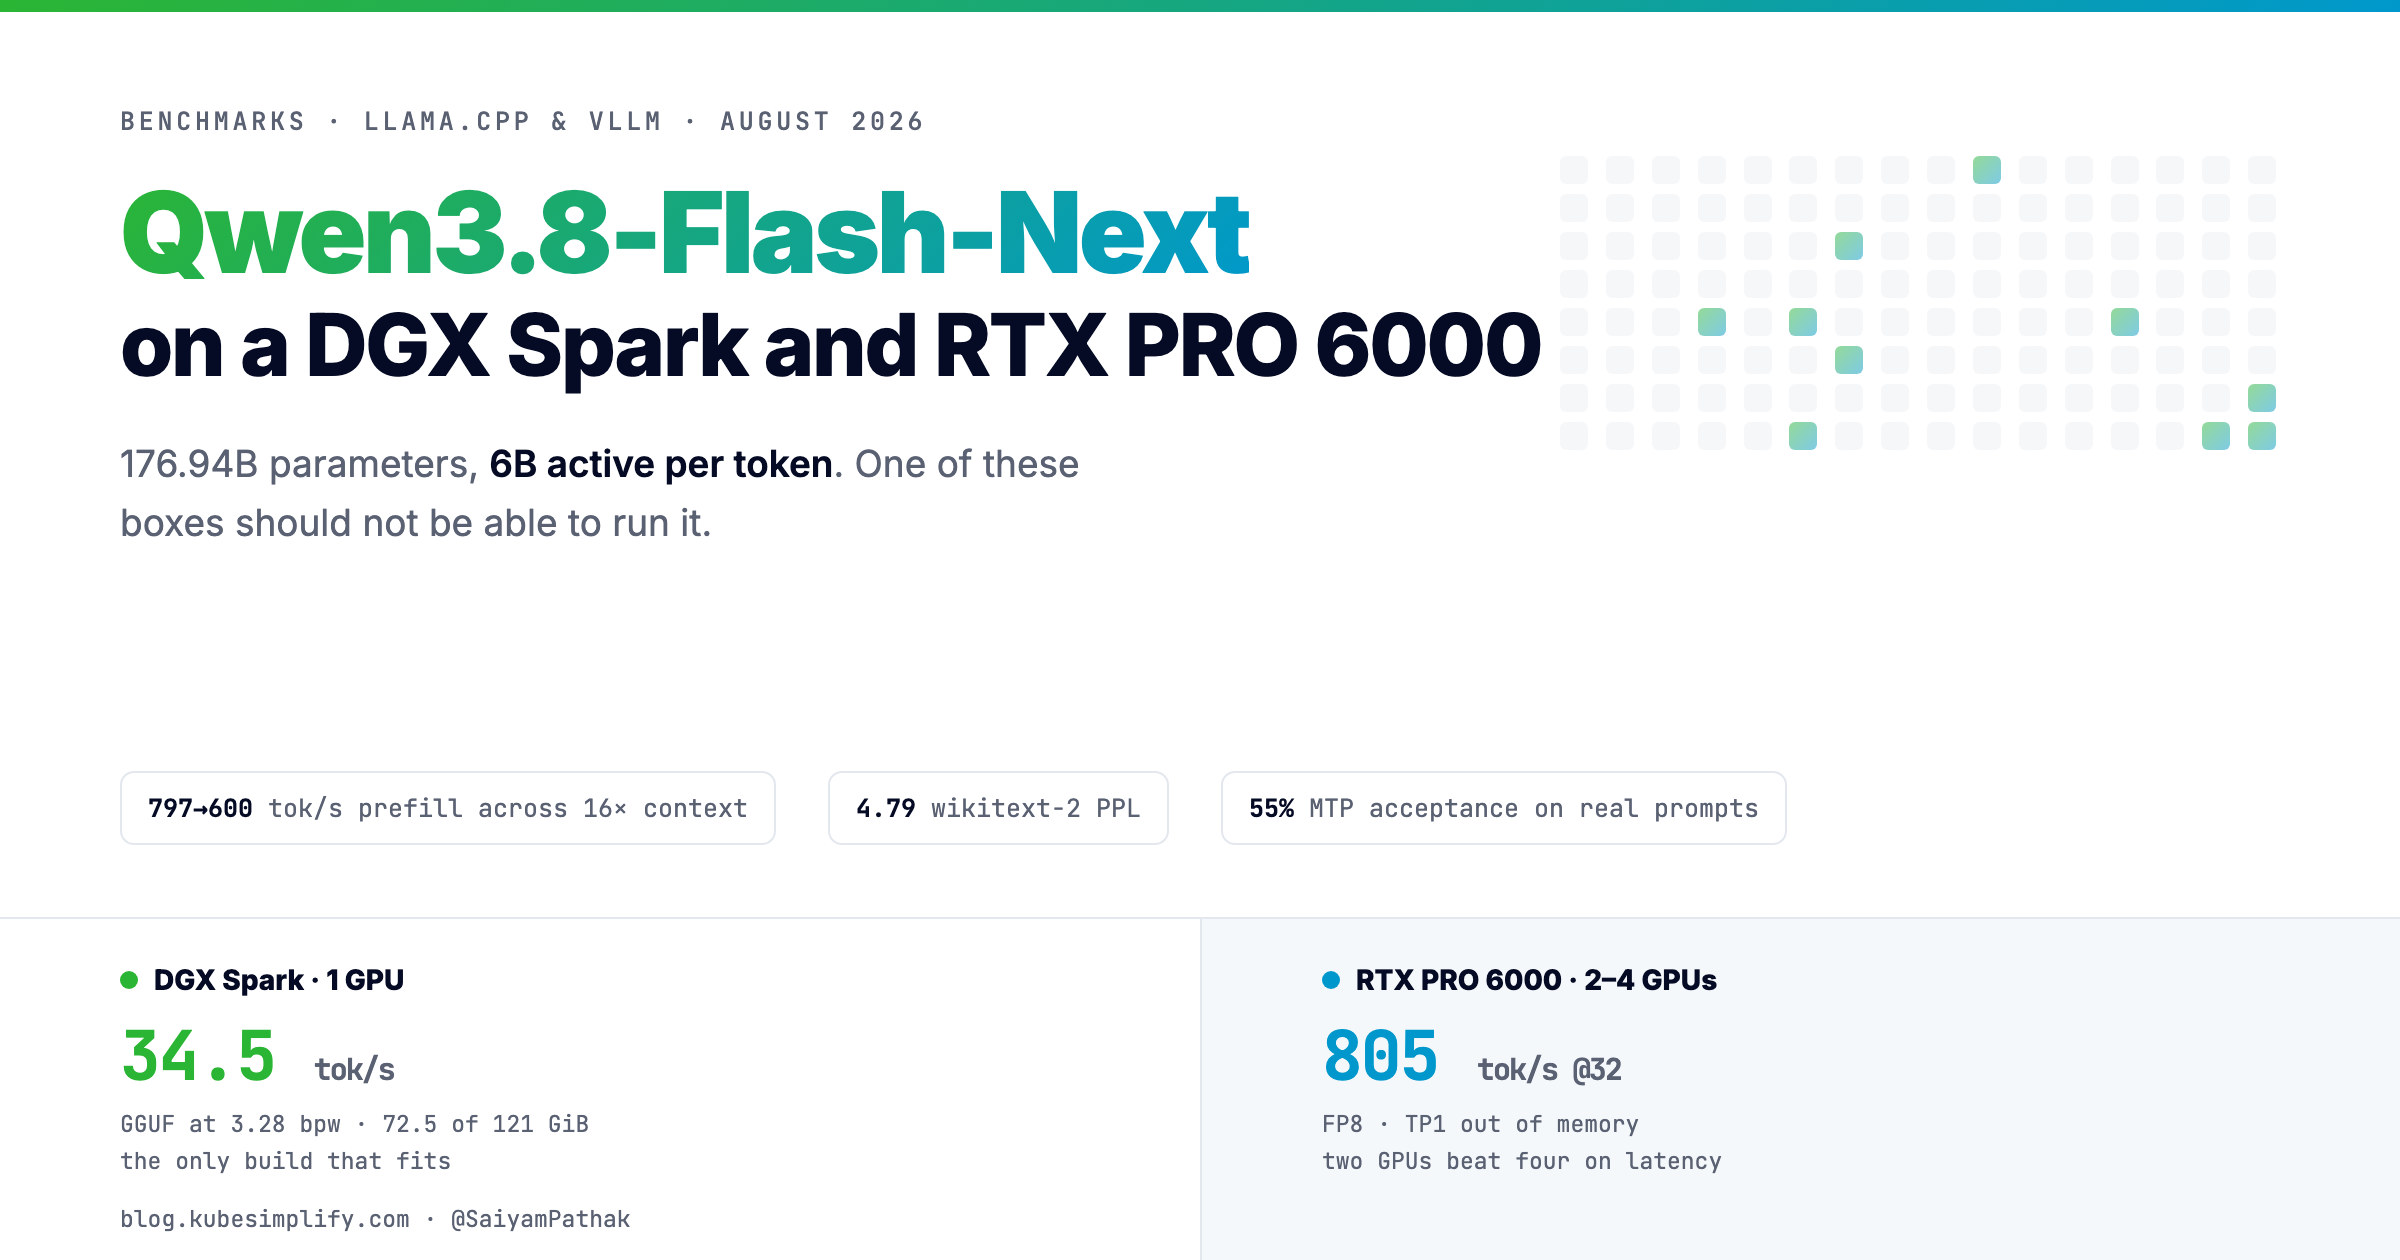
Qwen dropped Qwen3.8-Flash-Next this week, and the first thing I saw on my timeline was somebody saying it will not fit on a single DGX Spark. The NVFP4 weights are around 135 GB, a Spark has 128 GB of unified memory, so you need two of them.
That is correct. I checked it and I will show you why. But it is also only part of the story, because there is one build of this model that does fit on a single Spark, and the reason it fits turned out to be more interesting than the fitting.
I have a DGX Spark and access to a box with 8 RTX PRO 6000 Blackwell cards, so let's run it on both and see what the numbers actually look like.
In this post we will go through:
- What Qwen3.8-Flash-Next actually is, and why its size is confusing
- Why "NVFP4 is 135 GB" and "the GGUF is 67 GB" are both true for the same model
- Getting it running on a single DGX Spark with llama.cpp
- Getting it running on RTX PRO 6000 with vLLM, and how it scales across 1, 2 and 4 GPUs
- Why two GPUs beat four on this hardware
Every number in this post was measured on my own machines. Where I quote somebody else's number, I say so.
What the model is #
Qwen3.8-Flash-Next is a mixture-of-experts model. Total parameters are 176.94B, and that splits into two very different halves:
- 125B in the model proper, of which 512 experts do most of the work. For any given token the router picks only 10 experts plus 1 shared expert.
- 51B in an N-gram embedding table, which is a giant lookup table rather than something you do maths with.
Qwen puts the active parameters at about 6B per token. That is the whole point of the design: you get the knowledge of a very large model while paying the compute bill of a small one. Worth noting llama.cpp labels the same model A3B, so the two are counting slightly different things, and I have not dug into which is right.
The attention is a hybrid. Three out of every four layers use Gated DeltaNet, which compresses the history into a fixed-size state, and every fourth layer uses Qwen Sparse Attention (QSA), which looks at the full context but only scores it in compressed blocks. Qwen calls this a preview of the Qwen4 architecture, and the model type in config.json is literally qwen4_exp.
Why the size question is confusing #
Here is where I lost an hour, so let me save you the same trouble.
You would assume "NVFP4" means the whole model is squeezed into 4 bits. It does not. I opened quantization_config in both official checkpoints, and both have a modules_to_not_convert list. Only the routed experts get quantized. Attention, GDN, QSA, shared experts, routers, lm_head, embeddings, the vision encoder and the MTP head all stay in BF16.
The routed experts are 120.8B of the 125B, so that still covers most of the model. But the 51B N-gram table is the problem. It is stored as FP8 and expanded to BF16 when loaded, which is about 102 GB sitting in memory.
That is why the four builds are so far apart in size:
| Build | Size on disk | Fits one Spark (121 GiB usable)? |
|---|---|---|
| BF16 | 335.3 GiB | No |
| FP8 | 172.8 GiB | No |
| NVFP4 | 135.3 GB | No |
GGUF UD-IQ1_S | 67.55 GiB | Yes |
The GGUF is the only build that quantizes the N-gram table too. That is the entire reason it fits.
Now, vLLM has a flag called VLLM_PLE_CPU_OFFLOAD=1 that pushes that table into host RAM. And this is not a hack somebody bolted on. The Qwen tech report says the tables are "held off the accelerator", and they placed the N-gram layer at layer 2 specifically so that fetching from host memory overlaps with the compute of layer 1. The architecture was designed for the table to live somewhere else.
Which is also why that flag does nothing on a Spark. On a Spark, host RAM is the same unified pool as GPU memory. There is nowhere to offload to.
Test environment #
| DGX Spark | RTX PRO 6000 box | |
|---|---|---|
| GPU | 1x GB10, 128 GB unified (124610 MiB visible to CUDA) | 8x RTX PRO 6000 Blackwell Server Edition, 97887 MiB each |
| Compute capability | 12.1 | 12.0 |
| Driver | 580.159.03 | 610.43.02 |
| Host RAM | shared with GPU | 1259 GB |
| GPU interconnect | n/a | No NVLink, every pair reports SYS |
| Engine | llama.cpp build 30, commit 035e227 | vLLM, image vllm/vllm-openai:qwen38-flash-next |
| Model build | unsloth/Qwen3.8-Flash-Next-GGUF UD-IQ1_S | Qwen/Qwen3.8-Flash-Next-FP8 |
On the RTX box only 4 of the 8 cards were free, so everything below uses GPUs 1, 4, 5 and 6.
Part 1: the DGX Spark #
llama.cpp support is not merged yet #
First problem. My existing llama.cpp knows QWEN3NEXT but not qwen4_exp, so it simply will not load this model. Support is an open pull request, #27742, written by Daniel Han of Unsloth - all 33 commits of it. Converter, text graph, sparse attention, vision and three quantizer fixes. The entire Spark half of this post exists because of that PR.
So we build it:
export PATH=$PATH:/usr/local/cuda/bin
git clone --depth 30 --branch qwen4exp/qwen3.8-flash-next \
  https://github.com/unslothai/llama.cpp.git ~/llama-qwen4exp
cd ~/llama-qwen4exp
cmake -B build -DGGML_CUDA=ON -DCMAKE_CUDA_ARCHITECTURES=121 \
      -DGGML_CUDA_FA=ON -DCMAKE_BUILD_TYPE=Release
cmake --build build --config Release -j 16 \
--target llama-server llama-cli llama-bench llama-perplexity121 is the GB10 compute capability. Check it worked:
$ ~/llama-qwen4exp/build/bin/llama-cli --version
version: 0.3.0-dev (build 30, commit 035e227)
built with GNU 13.3.0 for Linux aarch64Getting the weights #
hf download unsloth/Qwen3.8-Flash-Next-GGUF --local-dir ~/qwen38/ggufIf that stalls at 0 B/s, it is the Xet transport. Set HF_HUB_DISABLE_XET=1 and keep the worker count at 6 to 8. I tried 24 workers and got SSL handshake timed out.
Running it #
~/llama-qwen4exp/build/bin/llama-server \
  -m ~/qwen38/gguf/UD-IQ1_S/Qwen3.8-Flash-Next-UD-IQ1_S-00001-of-00003.gguf \
-ngl 999 -c 16384 --host 127.0.0.1 --port 8099 --jinjaIt loads in about 30 seconds and sits at 72.5 GiB of the 121 GiB available. That leaves roughly 49 GiB free, which is a lot more headroom than I expected.
Here is llama-bench, three repetitions:
~/llama-qwen4exp/build/bin/llama-bench \
  -m ~/qwen38/gguf/UD-IQ1_S/Qwen3.8-Flash-Next-UD-IQ1_S-00001-of-00003.gguf \
-ngl 999 -p 2048,8192,32768 -n 128 -r 3| model | size | params | backend | ngl | test | t/s |
| qwen4exp A3B IQ1_S | 67.55 GiB | 176.94 B | CUDA | 999 | pp2048 | 797.76 ± 2.08 |
| qwen4exp A3B IQ1_S | 67.55 GiB | 176.94 B | CUDA | 999 | pp8192 | 747.53 ± 3.24 |
| qwen4exp A3B IQ1_S | 67.55 GiB | 176.94 B | CUDA | 999 | pp32768 | 599.65 ± 1.18 |
| qwen4exp A3B IQ1_S | 67.55 GiB | 176.94 B | CUDA | 999 | tg128 | 34.54 ± 0.18 |34.5 tokens per second on a single Spark, for a model with 176.94B parameters.
I did not believe that at first either, so let's sanity check it two ways.
First against the hardware. The GB10 is specified at about 273 GB/s of memory bandwidth (that is the spec sheet, not something I measured). Decoding reads roughly 5.37 GB per token here, because only 2.36B of the 120.8B expert parameters are touched for any given token. That puts the ceiling around 50 tok/s, and we measured 34.5, or 68% of it. Comfortably under the roof, which is where a real measurement should sit.
Second against my own earlier numbers. When I benchmarked the dense Qwen3.8-27B on this same Spark a couple of weeks ago, llama.cpp gave 11.6 tok/s. A sparse 177B model running about three times faster than a dense 27B one is what you would expect when only a small slice is active per token.
The prefill curve is the interesting bit #
Look again at those prefill numbers. Going from 2,048 tokens to 32,768 tokens is 16 times the context, and throughput only drops 25%. That flatness is consistent with QSA doing its job, although I should be honest that I did not run a dense-attention ablation to prove QSA is the cause.
"IQ1_S" is not a 1-bit model #
The quant is called UD-IQ1_S and llama.cpp reports IQ1_S - 1.5625 bpw, which makes it sound like a 1-bit model. So I dumped the actual tensor types in the file:
| Type | Size | Share |
|---|---|---|
| IQ4_NL | 47.92 GiB | 70.9% |
| IQ1_S | 10.38 GiB | 15.4% |
| IQ2_XXS | 5.64 GiB | 8.3% |
| Q5_K, Q8_0, Q4_K, Q6_K, F32, BF16 | 3.63 GiB | 5.4% |
Effective 3.28 bits per weight, not 1.56. Seventy percent of the bytes are ordinary 4-bit. Unsloth's dynamic quants spend the bit budget where it matters and squeeze the rest, and the biggest thing getting squeezed is that 51B lookup table.
What it costs you #
A couple of prompts coming back correct is not evidence that a quant is fine, so let's measure it with perplexity.
Quick definition, because the name is confusing and there is now a search company called Perplexity that has nothing to do with this. Perplexity scores how surprised a model is by text it has never seen. You feed it real writing and at each word check what probability it gave to the word that actually came next, then boil that down to roughly "how many words was it torn between at each step". Lower is better. It runs locally, no API involved.
# llama.cpp's own scripts/get-wikitext-2.sh is broken: it does not follow the
# S3 redirect and leaves you with a 467-byte XML error instead of a zip.
curl -sL -o /tmp/wt2.zip \
  "https://huggingface.co/datasets/ggml-org/ci/resolve/main/wikitext-2-raw-v1.zip"
unzip -oq /tmp/wt2.zip -d /tmp/

~/llama-qwen4exp/build/bin/llama-perplexity \
  -m ~/qwen38/gguf/UD-IQ1_S/Qwen3.8-Flash-Next-UD-IQ1_S-00001-of-00003.gguf \
-f /tmp/wikitext-2-raw/wiki.test.raw -ngl 999 -c 2048Final estimate: PPL = 4.7876 +/- 0.02848That is wikitext-2, 145 chunks at context 2048. Daniel Han reports 4.0068 for llama.cpp at high precision and 4.0126 for the reference implementation in the PR write-up. Those are his numbers, not mine, and I could not reproduce them because no higher-precision GGUF of this model has been published yet.
Taking his figure at face value, this quant costs roughly 19% higher perplexity. A normal Q4_K_M usually costs 1 to 3%. So it is a real trade, not a free lunch. It answers questions correctly in casual use, and I would still not reach for it when accuracy matters.
Part 2: RTX PRO 6000 with vLLM #
vLLM had day-zero support with a dedicated image, so this side was much less work than the Spark. Getting the 185 GB checkpoint down was the slow part:
docker pull vllm/vllm-openai:qwen38-flash-next
HF_HUB_DISABLE_XET=1 hf download Qwen/Qwen3.8-Flash-Next-FP8 --local-dir /llm/qwen38/fp8HuggingFace crawled from this box, so I pulled it from ModelScope instead, which serves the identical 145-file manifest.
docker run -d --name q38-tp2 --gpus '"device=1,4"' --ipc=host --shm-size=32g \
  -v /llm/qwen38:/llm/qwen38 -e VLLM_PLE_CPU_OFFLOAD=1 -p 8010:8000 \
  vllm/vllm-openai:qwen38-flash-next \
  --model /llm/qwen38/fp8 --served-model-name q38 \
  --tensor-parallel-size 2 --gpu-memory-utilization 0.90 \
  --max-model-len 32768 --max-num-seqs 32 \
  --enable-prefix-caching --no-enable-flashinfer-autotune \
--reasoning-parser qwen3If you leave out --reasoning-parser qwen3, the model's thinking text ends up inside the normal reply content. Ask for it.
For the TP4 runs it is the same command with --gpus '"device=1,4,5,6"' and
--tensor-parallel-size 4. To compare against keeping the N-gram table on the GPU, set
-e VLLM_PLE_CPU_OFFLOAD=0. For speculative decoding, append the MTP config shown later.
Every config below was benchmarked with exactly the same command, only $C changing:
docker exec q38-tp2 vllm bench serve \
  --backend openai-chat --model /llm/qwen38/fp8 --served-model-name q38 \
  --endpoint /v1/chat/completions --base-url http://localhost:8000 \
  --dataset-name random --random-input-len 1024 --random-output-len 512 \
--max-concurrency $C --num-prompts $((C*4)) --ignore-eosBefore benchmarking anything I asked it a question with a known answer, because a healthy /health endpoint does not mean the model is producing sense. It got "a train leaves at 14:35 and arrives at 21:10 the next day" right at 30 hours 35 minutes, so we are good.
How many GPUs do you need? #
--tensor-parallel-size (TP) is how many GPUs each layer's weight matrices are sliced across. Not "layer 1 on this GPU, layer 2 on that one", that is pipeline parallelism. TP cuts every matrix into pieces, so each GPU computes a partial answer and then they all swap and add. That swap is an all-reduce and it happens at every layer, for every token.
With the N-gram table offloaded to host RAM, the weights need about 123 GiB on the GPU, and each card has 95.6 GiB. So one card should not be enough. It is not:
torch.OutOfMemoryError: CUDA out of memory. GPU 0 has a total capacity of
95.01 GiB of which 210.38 MiB is free ... 94.02 GiB is allocated by PyTorchTP3, by the way, is not an option at all. I assumed this was about the 2 KV heads on the attention layers, so I tried it to be sure, and the real reason is different:
AssertionError: 16 is not divisible by 3The 16 is linear_num_key_heads, the key heads in the Gated DeltaNet layers, and those are 36 of the 48 layers. Your TP size has to divide 16, so the usable values are 1, 2, 4, 8 and 16.
Here is TP2 and TP4, benchmarked with 1024 input and 512 output tokens:
| Config | 1 stream | 32 streams | Median TPOT, 1 stream | KV cache |
|---|---|---|---|---|
| TP1 | out of memory | - | - | - |
| TP2 | 81.45 tok/s | 739.06 tok/s | 10.01 ms | 19.6 GiB |
| TP4 | 64.61 tok/s | 805.38 tok/s | 13.85 ms | 48.74 GiB |
Two GPUs are 26% faster than four for a single user. That surprised me until I looked at the wiring. This box has no NVLink, and nvidia-smi topo -m reports every GPU pair as SYS, meaning traffic crosses PCIe and the CPU sockets. Now remember only 6B parameters are active per token, so there is barely any maths to divide up. Splitting a tiny job across more GPUs mostly means paying more postage. The extra cards still earn their keep under load, where the bigger KV cache lets you batch 32 users and win on total throughput.
The practical rule: use the smallest TP that fits in memory, and only go wider when you need the KV cache for longer context or more users.
There is also no pipeline-parallel escape hatch here. The vLLM recipe states the N-gram embedding does not support pipeline parallelism, so on a box with bad interconnect you cannot fall back to PP the way you normally would.
What does offloading the N-gram table actually cost? #
The tech report implies host prefetching is nearly free. On this hardware it is cheap but not free:
| TP4 config | 1 stream | 32 streams | KV cache |
|---|---|---|---|
| N-gram table on GPU | 74.84 tok/s | 772.16 tok/s | 4.7 GiB |
| N-gram table on host | 64.61 tok/s | 805.38 tok/s | 48.74 GiB |
Keeping the table on the GPU is about 16% faster for one user, because you skip the round trip over PCIe. But it eats the memory your KV cache wanted, and it collapses from 48.74 GiB to 4.7 GiB. Maximum concurrency drops from 74x to 10x.
Unless you are serving exactly one person, offload it.
Speculative decoding, and why benchmark workload decides the answer #
The model ships an MTP head, so let's turn it on:
--speculative-config '{"method":"mtp","num_speculative_tokens":3}'Measured with the same vllm bench serve command as everything above, which uses
synthetic random tokens:
| TP4 config | 1 stream | 32 streams | Median TTFT at 32 |
|---|---|---|---|
| without MTP | 64.61 tok/s | 805.38 tok/s | 2578 ms |
| with MTP | 87.87 tok/s | 693.72 tok/s | 588 ms |
That reads as 36% faster for one user, at the cost of 14% of peak throughput. I nearly left it there. Then someone asked what the acceptance rate was, which is the number that actually decides whether speculative decoding is worth anything, and I had not measured it.
vLLM exposes it. Here is what the counters say:
| workload | acceptance | mean accepted length |
|---|---|---|
| synthetic random, 1024 in / 512 out | 71.3% | 3.14 of max 4 |
| synthetic random, 512 in / 256 out | 84.4% | 3.53 of max 4 |
| real code and prose prompts, greedy | 55.3% | 2.66 of max 4 |
Real prompts accept considerably worse than random ones. That is the opposite of what I
expected, and the reason is worth knowing if you benchmark anything: --dataset-name random
feeds the model random token IDs. Given nonsense, it produces repetitive low-entropy text,
and a draft head predicts repetitive text very easily. Random-token benchmarks flatter
speculative decoding.
So I re-ran on five genuine prompts, an LRU cache in Python, a Kubernetes explanation, a Go CSV reader, a bash one-liner and a plain-English TP explainer, greedy decoding, single stream, measuring wall clock:
| TP4, real prompts, temp 0 | tok/s |
|---|---|
| without MTP | 49.90 |
| with MTP | 124.93 |
2.5x. Far better than the 36% the synthetic benchmark implied, despite the lower acceptance rate. Note this is a different measurement method from the table above, wall clock across whole requests rather than vLLM's output-token throughput, so compare within each table and not across them.
The lesson is not that one number is right and the other wrong. Both are real. It is that a speculative decoding result without its workload and its acceptance rate does not tell you anything you can act on.
Does MTP change the answer? #
Speculative decoding is supposed to be lossless. The draft head proposes, the full model verifies, and rejected tokens are discarded, so the output distribution should be untouched. Worth checking rather than trusting.
Same prompt, temperature 0, seed 42, five runs each, on the same four GPUs with the same checkpoint, MTP the only variable:
MTP off : 3575aff8aa9c1df5  x5
MTP on : 3575aff8aa9c1df5 x5Byte-identical, and identical to each other. Speculative decoding here costs you nothing in output fidelity. Worth knowing if you cache responses or snapshot-test them.
For reference, llama.cpp on the Spark is also fully deterministic across five runs, though that is a different box and a different quant so the hashes are not comparable.
One caveat on all of this: single stream. Under continuous batching, vLLM's batch composition varies between runs and that is where reproducibility usually breaks, not from MTP.
One card, with NVFP4 #
There is a community NVFP4 build from RadixArk. It is documented for SGLang, but vLLM picked it up anyway (Detected ModelOpt NVFP4 checkpoint):
docker run -d --name q38-nvfp4-tp1 --gpus '"device=1"' --ipc=host --shm-size=32g \
  -v /llm/qwen38:/llm/qwen38 -e VLLM_PLE_CPU_OFFLOAD=1 -p 8012:8000 \
  vllm/vllm-openai:qwen38-flash-next \
  --model /llm/qwen38/nvfp4 --served-model-name q38 \
  --tensor-parallel-size 1 --gpu-memory-utilization 0.93 \
  --max-model-len 16384 --max-num-seqs 16 \
--no-enable-flashinfer-autotune --reasoning-parser qwen3The weights genuinely fit on a single card:
Actual usage is 74.75 GiB for consumed memory (weights + non-torch),
1.85 GiB for peak activation, and 0.28 GiB for CUDAGraph memory.
Current kv cache memory in use is 11.76 GiB.74.75 GiB of weights on one 95.6 GiB card, with 11.76 GiB of KV cache left over. So the memory answer is yes.
I cannot give you a speed number though. The engine finished loading, captured its CUDA graphs at 06:34:14, and then the API server never came up. Twenty minutes later Application startup complete had still not been printed a single time, /health was refusing connections, and one CPU core was spinning. The only errors in the log were harmless transformers docstring warnings. RadixArk documented this checkpoint for SGLang and not vLLM, so I am not shocked, but I am not going to invent a number I did not measure.
Both machines side by side #
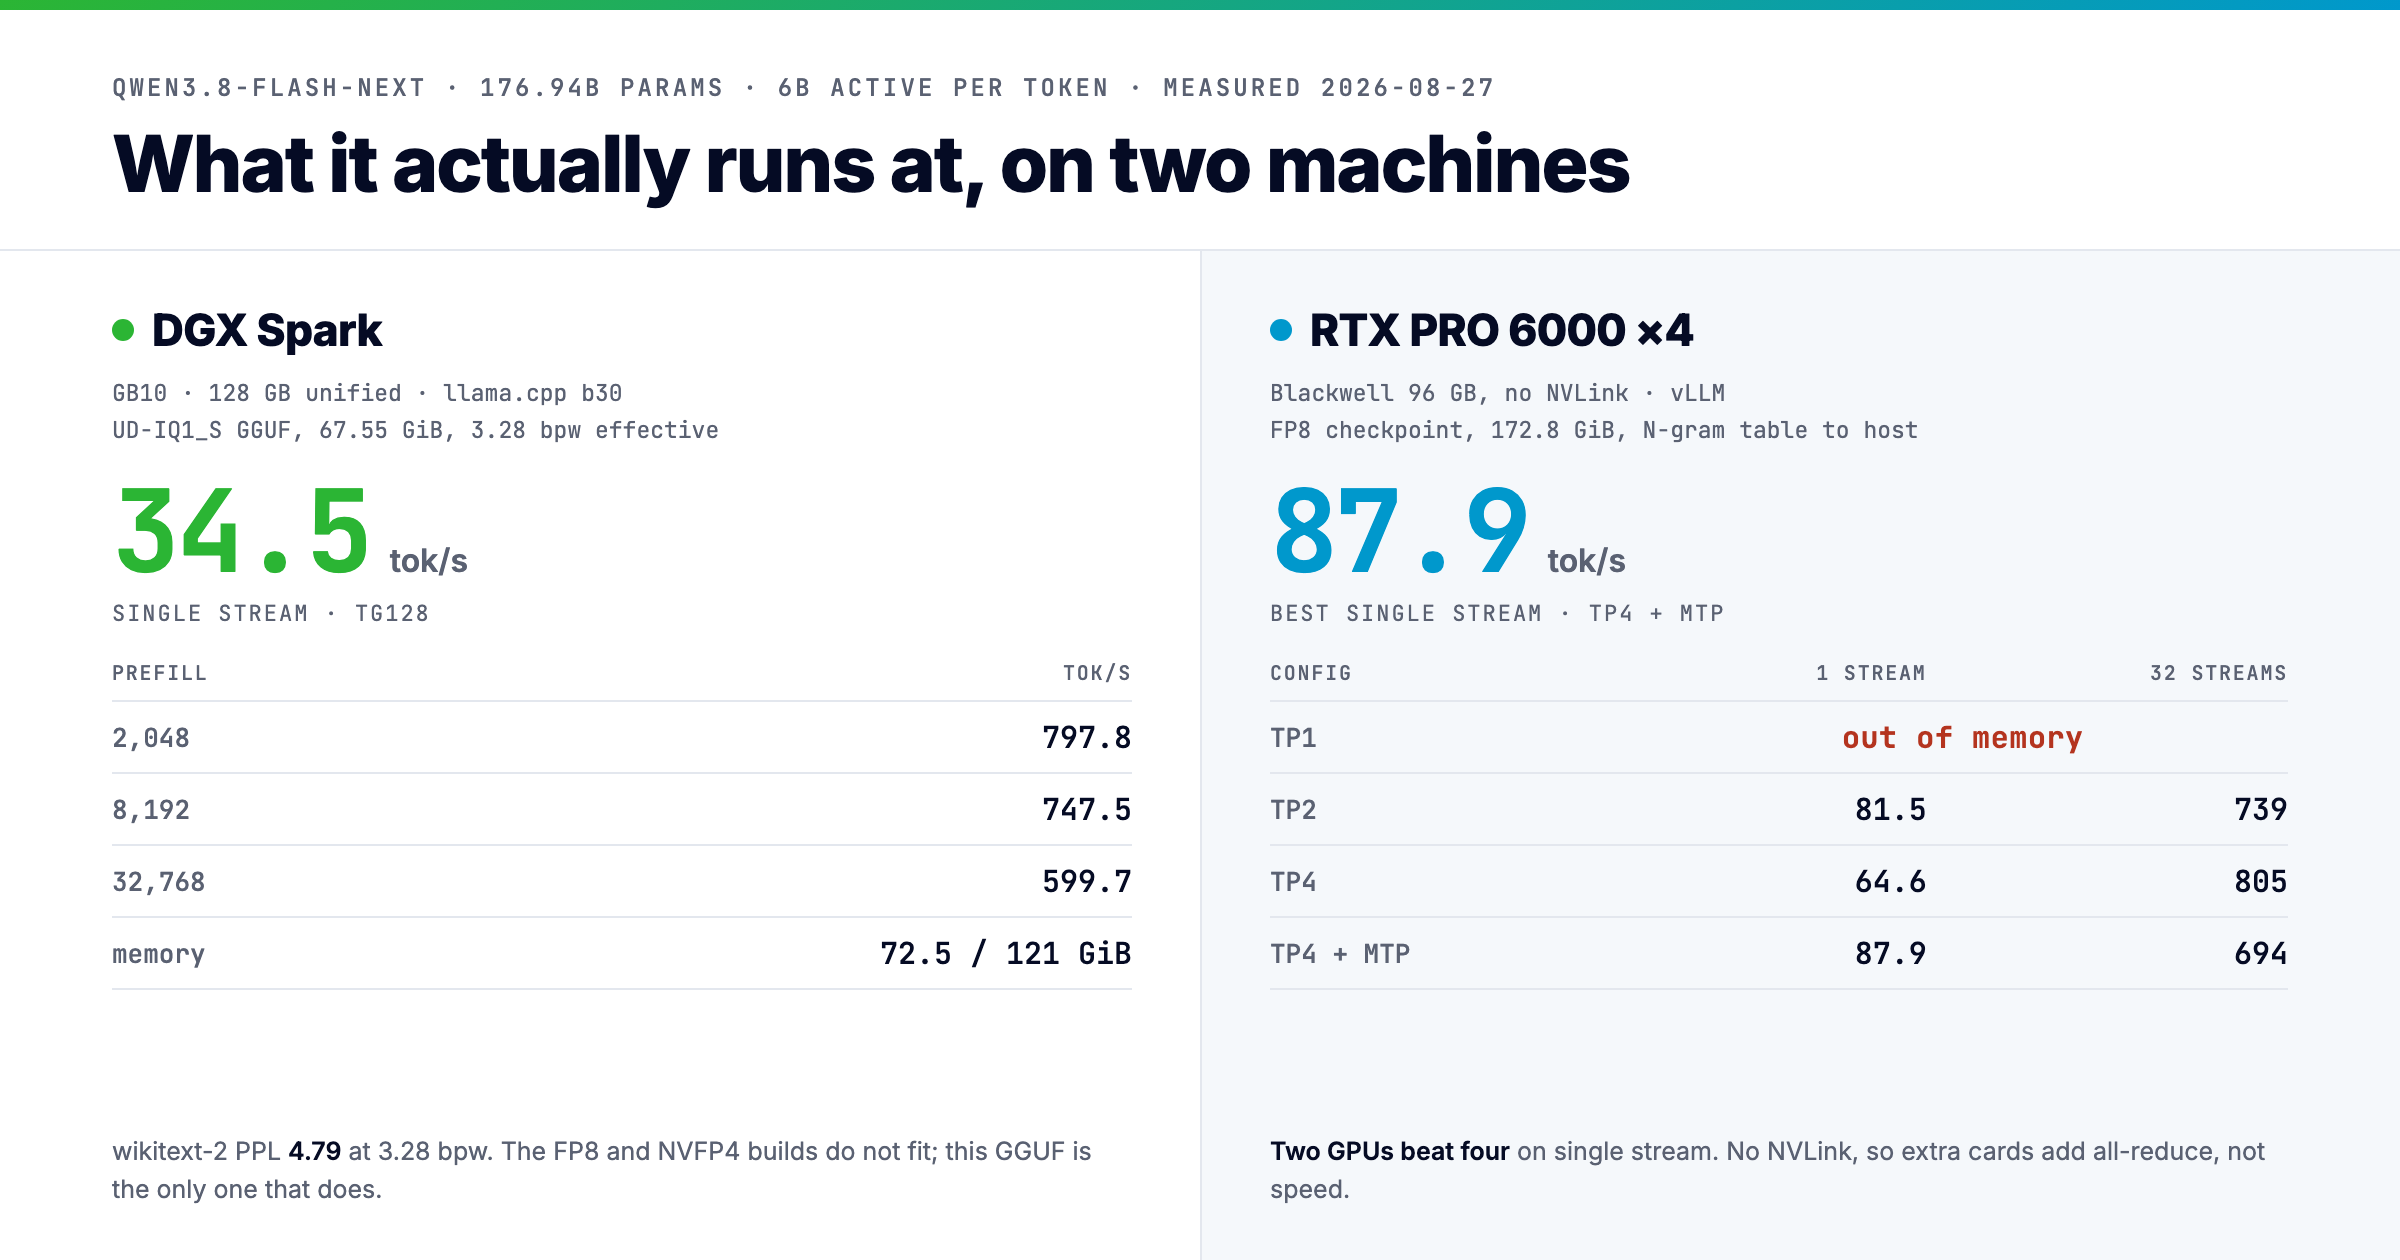
| DGX Spark | RTX PRO 6000 | |
|---|---|---|
| Build | GGUF UD-IQ1_S, 3.28 bpw | FP8, 172.8 GiB |
| Engine | llama.cpp (unmerged PR) | vLLM (day-zero support) |
| GPUs used | 1 | 2 or 4 |
| Best single stream | 34.5 tok/s | 87.9 tok/s (TP4 + MTP) |
| Best throughput | not measured | 805 tok/s at 32 streams |
| Memory | 72.5 of 121 GiB | ~66 GiB per GPU at TP2 |
These are not really competing. One is a desktop box running a heavily compressed build, the other is four datacenter cards running the full FP8 checkpoint. What I find genuinely interesting is that the gap is only about 2.5x.
What I did not measure #
To be straight about the edges of this post:
- No high-precision perplexity baseline. The 4.0068 and 4.0126 figures are the PR author's, and no higher-precision GGUF exists yet for me to check them against.
- No proof that QSA causes the flat prefill curve. It is consistent with the architecture, but I ran no ablation.
- No NVFP4 throughput. The weights fit on one card, the server never came up.
- No concurrency sweep on the Spark. llama-bench numbers there are single stream.
- No BF16 run anywhere. At 335 GiB it was not worth the download.
Thanks #
Two things made the Spark side of this possible and both came from the same place.
Daniel Han at Unsloth wrote the llama.cpp support in PR #27742, every commit of it, within a day of the model landing. He also published the dynamic quant that is the only build small enough to fit on one Spark, and his write-up of the PR includes perplexity and top-1 agreement numbers against the reference implementation, which is what let me sanity check my own. That is a lot of careful work given away for free.
Thanks also to the llama.cpp maintainers, and to RadixArk for the NVFP4 conversion, which fit on a single RTX PRO 6000 even though I could not get it serving.
Wrapping up #
The claim that started this was right: NVFP4 does not fit on one DGX Spark. But a single Spark still runs this 177B model at 34.5 tok/s through llama.cpp, because Unsloth's GGUF is the one build that also compresses the 51B N-gram table, and it costs you about 19% perplexity to do it.
On the RTX PRO 6000 box the surprise was that two GPUs beat four for a single user. If you are sizing hardware for sparse MoE models, more cards past the point where the weights fit will buy you batch throughput and KV cache, not lower latency, especially without NVLink.
The scripts, recipes and raw benchmark output are in the repo if you want to reproduce any of this. If you run it on different hardware I would love to see your numbers, so send them over on X @SaiyamPathak.
Saiyam is working as Head of DevRel at vCluster Labs. He is the founder of Kubesimplify, focusing on simplifying cloud-native & AI infrastructure. He is KubeCon Co-chair and has worked on many facets of Kubernetes, including machine learning platforms, scaling, multi-cloud, & managed Kubernetes services. When not coding, Saiyam contributes to the community by writing blogs and organizing local meetups for Kubernetes and CNCF. He is also a CNCF TAG OpsRes Chair & can be reached on Twitter @saiyampathak.
Get new posts in your inbox.
Spotted a typo or want to improve this post? Edit on GitHub →