10 Things You Might Not Know About K9s
What is the most comfortable ways to access and interact with the Kubernetes API.


On this page (13)
K9s? #
But before we start to jump straight into K9s, let us step back and talk shortly about: What is K9s? And why should you consider using it?
For me, it starts with a simple question: What is the most comfortable ways to access and interact with the Kubernetes API.
Like everybody else, I have been using the [kubectl] (https://kubernetes.io/docs/reference/kubectl/overview/) command line tool to interact with the Kubernetes API. But I quickly realized that it is not the most comfortable way to do so, as you need to know the exact syntax of the commands and how to use them.
And, OMG!, there are a lot of commands to remember: Currently I think around 43 command (create, get, run, expose, delete, apply. annotate, autoscale, debug ,diff ,edit, kustomize, label, patch, replace, rollout, scale, set, wait, attach, auth, cp, describe, exec, logs, port-forward, proxy, top, api-versions, certificate, cluster-info, cordon, drain, taint, uncordon, alpha, api-resources, completion, config, explain, options, plugin, version)

Now add the way on how to configure and present the output in the mix, and you can guess what I mean. Perfectly fine for scripts or pipelines, but not for me and the occasions I need to interact with the Kubernetes API.
I have a specific problem I want to solve quickly. For example, see the events of a certain pod I don't know the exact name of and then maybe quickly edit an attribute or amend the manifest for testing purposes.
That's the moment I had to look around for are more comfortable solutions. But... but... but, I don't want to leave the terminal. So I am looking for a solution which provides a terminal like experience with an easy-to-use UI.
The combination of both is called K9s. K9s offers a slick TUI (terminal user interface) to interact with.
10 Things You Might Not Know About K9s #
So after this relative long introduction, let's jump straight into some hidden gems of K9s. I assume that you already installed K9s, but if not, please do so. I wait, promised!
Your back? Good! Let's start:
Configure K9s Via The Config File #
K9s offers a configuration file which can be used to configure the UI. You can find the configuration under $XDG_CONFIG_HOME/k9s
If you have trouble to find the file, just type:
k9s info
 ____  __.________
|    |/ _/   __   \______
|      < \____    /  ___/
|    |  \   /    /\___ \
|____|__ \ /____//____  >
        \/            \/

Configuration:   /Users/dirien/Library/Application Support/k9s/config.yml
Enable Mouse Support #
Yes, you read it correctly, K9s supports the use of your mouse! To enable the mouse support, change the following line in the configuration file:
k9s:
  enableMouse: true
Disable The K9s Header And Logo #
If you want to get rid of the K9s header to gain more screen real estate, modify the following line in the configuration file:
k9s:
  headless: true
For disabling the logo, you need to set the following line in the configuration file to true:
k9s:
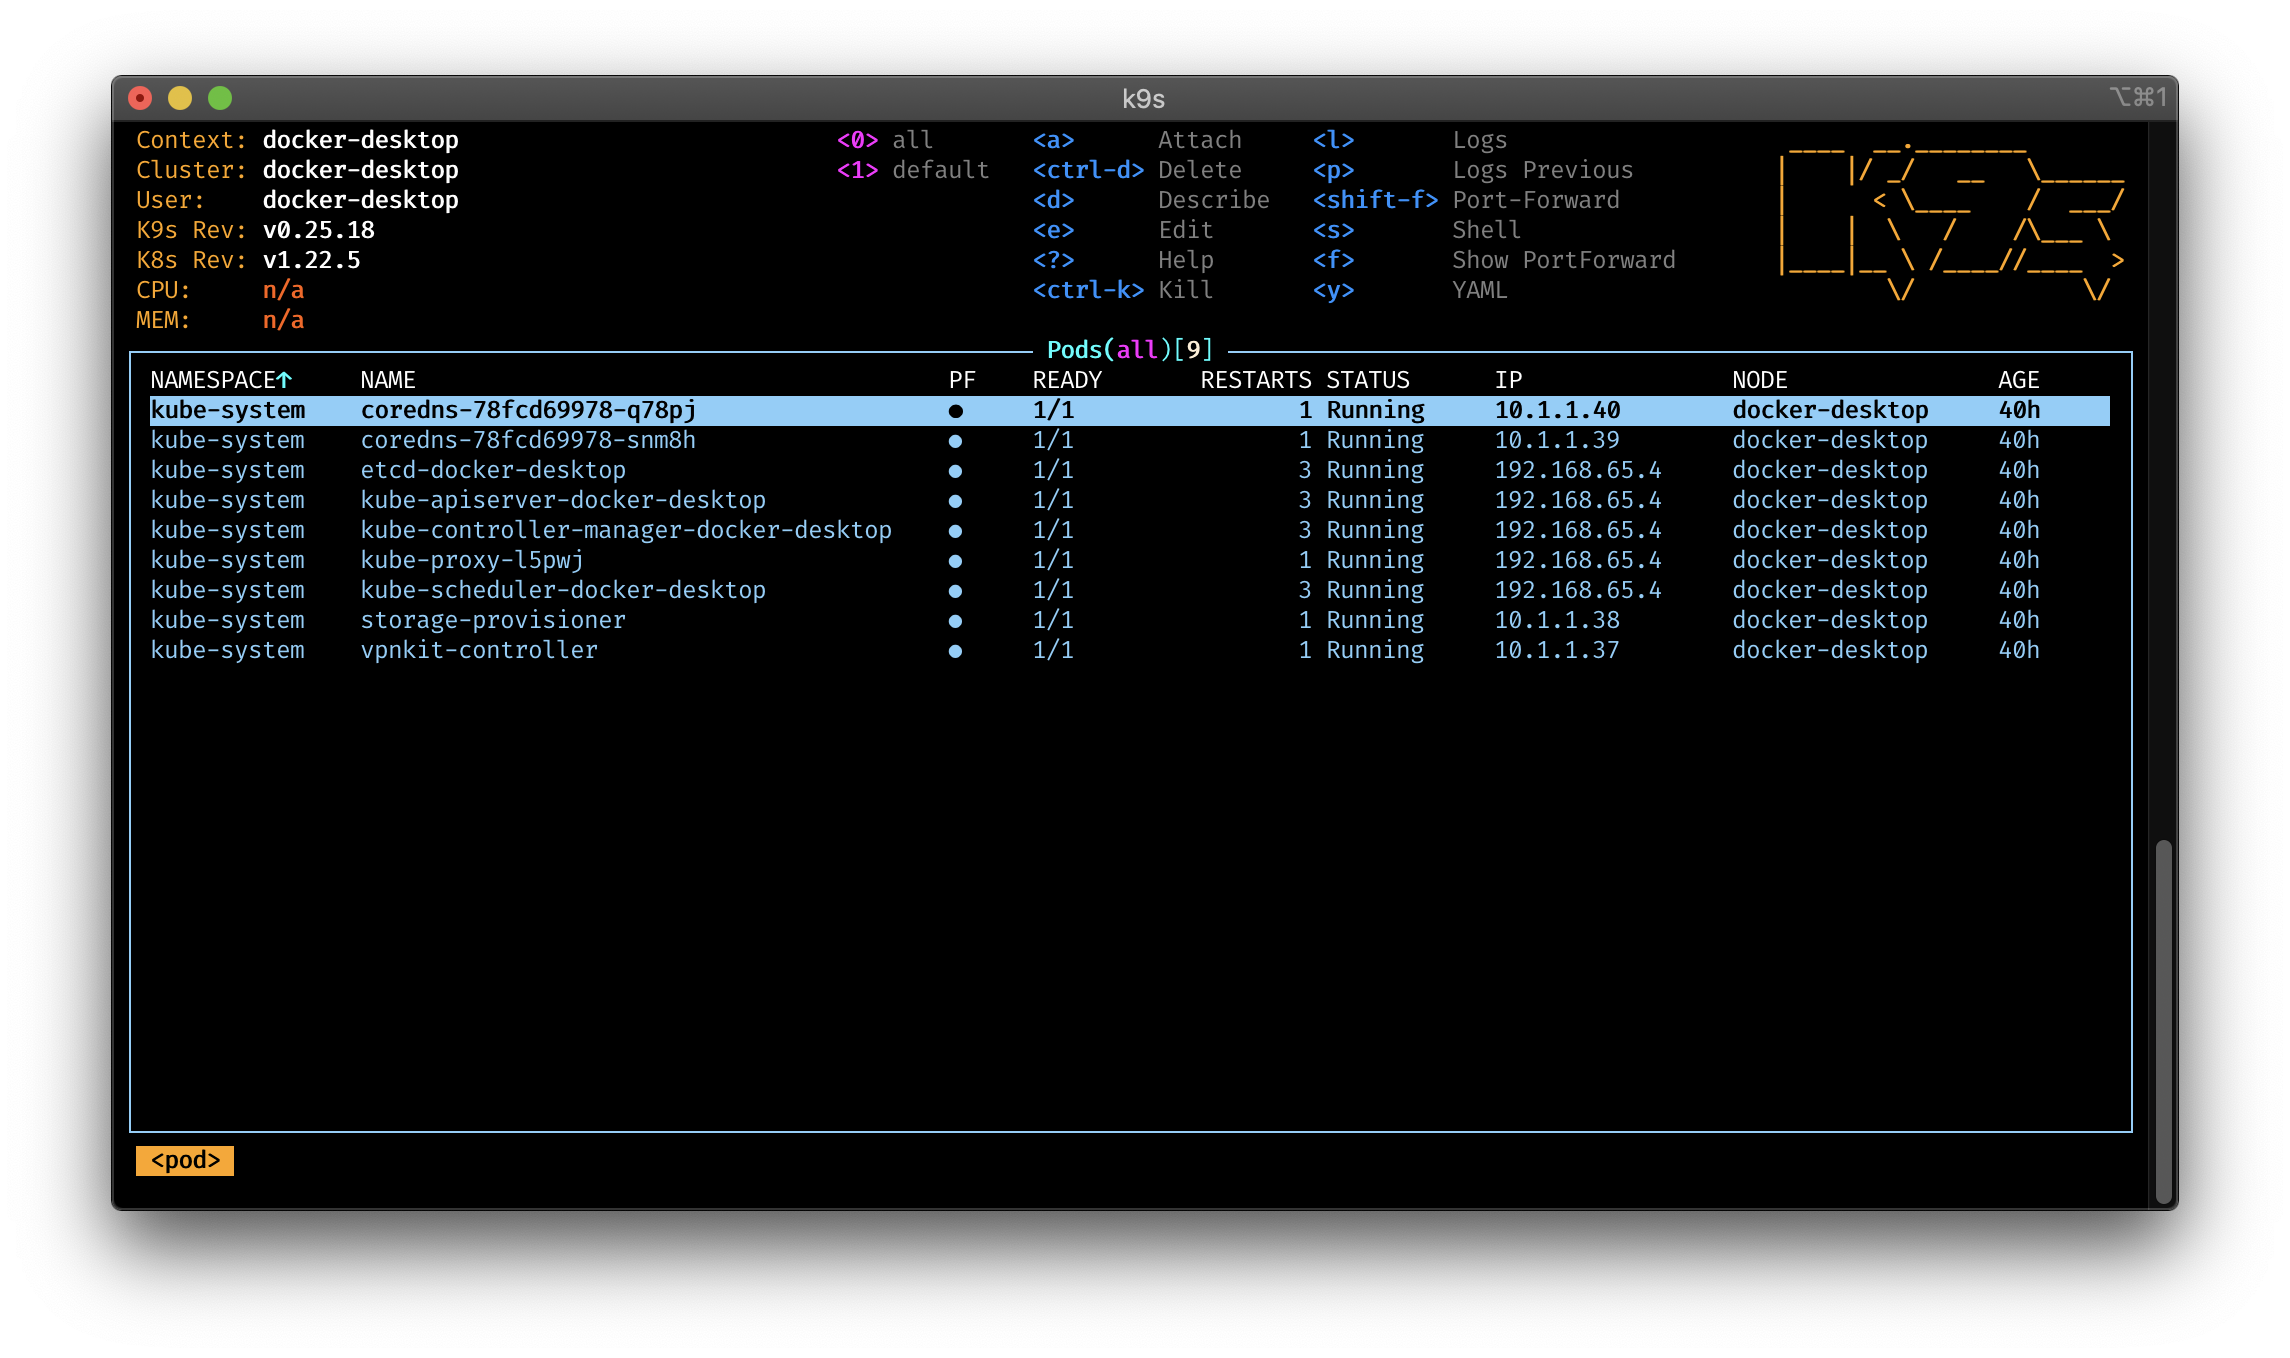
logoless: trueCustom Alias Support #
You can create your own aliases for the commands. Create a file $XDG_CONFIG_HOME/k9s/aliases.yml add your own aliases:
alias:
  # Use engin as an alias for Pod
  engin: v1/pods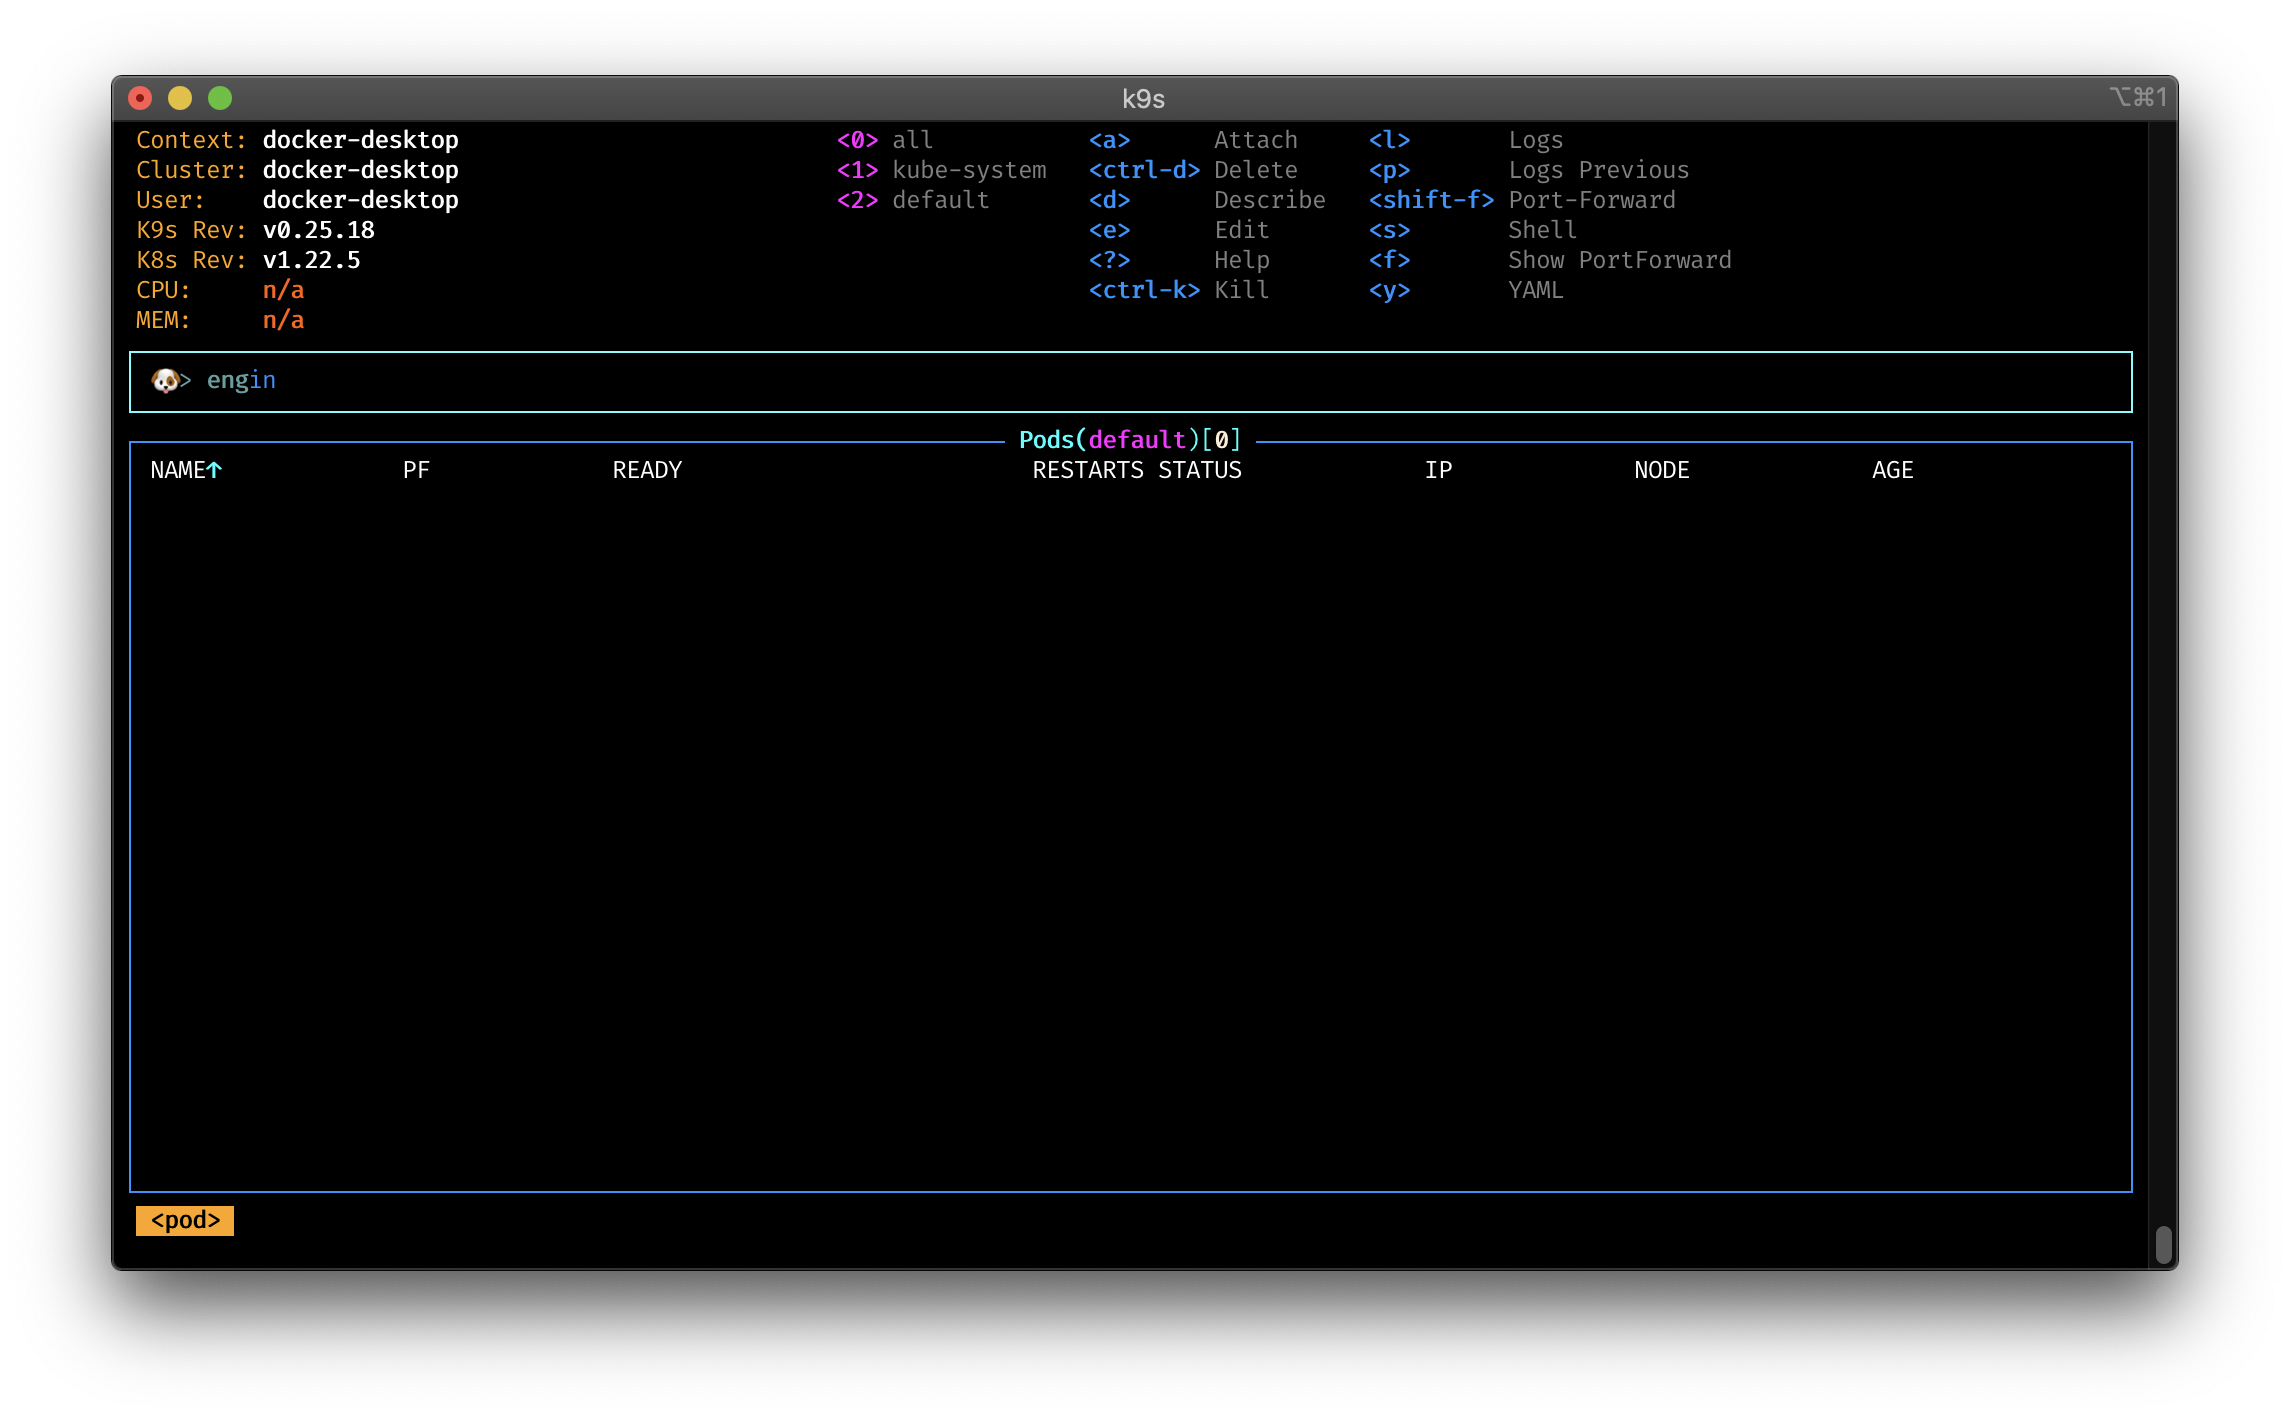
Write Your Own Plugins #
With K9s, you can extend your command line and tooling by writing your own plugins. All plugins are defined in $XDG_CONFIG_HOME/k9s/plugin.yml file. Writing your own plugins is very easy.
A plugin consist from following parts:
Shortcut: This represents the key combination to activate your pluginDescription: Will be printed next to the shortcut in the K9s menuScopes: Defines a collection of resources name/short-name for the views associated with your plugin.Command: Represents the commands your plugin runs upon activationBackground: Specifies if the command should run in the background, or not!Args: Specifies the various arguments that should apply to the command defined in theCommandfield.
On top, you have access to some predefined environment variables, you can use in your own plugin:
$NAMESPACE– the selected resource namespace$NAME– the selected resource name$CONTAINER– the current container if applicable$FILTER– the current filter if any$KUBECONFIG– the KubeConfig location.$CLUSTERthe active cluster name$CONTEXTthe active context name$USERthe active user$GROUPSthe active groups$PODwhile in a container view$COL-<RESOURCE_COLUMN_NAME>use a given column name for a viewed resource. Must be prefixed byCOL-!
With all the information, we can write start to write our own plugins. Here is an example to include lineage, trivyand cosign as plugins to scan for vulnerabilities in your images, config and check for the signature of your images.
plugin:
lineage:
shortCut: Ctrl-L
confirm: false
description: "lineage"
scopes:
- deploy
command: sh
background: false
args:
- -c
- "kubectl lineage deploy $NAME -n $NAMESPACE --context $CONTEXT | less"
trivy:
shortCut: Ctrl-T
confirm: false
description: "trivy image"
scopes:
- container
command: sh
background: false
args:
- -c
- "trivy -q image --ignore-unfixed $COL-IMAGE | less"
sbom:
shortCut: Ctrl-S
confirm: false
description: "trivy sbom"
scopes:
- container
command: sh
background: false
args:
- -c
- "trivy -q sbom $COL-IMAGE | jq | less"
config:
shortCut: Ctrl-K
confirm: false
description: "trivy config"
scopes:
- deploy
command: sh
background: false
args:
- -c
- "kubectl get deploy $NAME -n $NAMESPACE -o yaml --context $CONTEXT > $NAME.yaml | (trivy -q config $NAME.yaml && rm $NAME.yaml) | less"
cosign:
shortCut: Ctrl-V
confirm: false
description: "cosign"
scopes:
- container
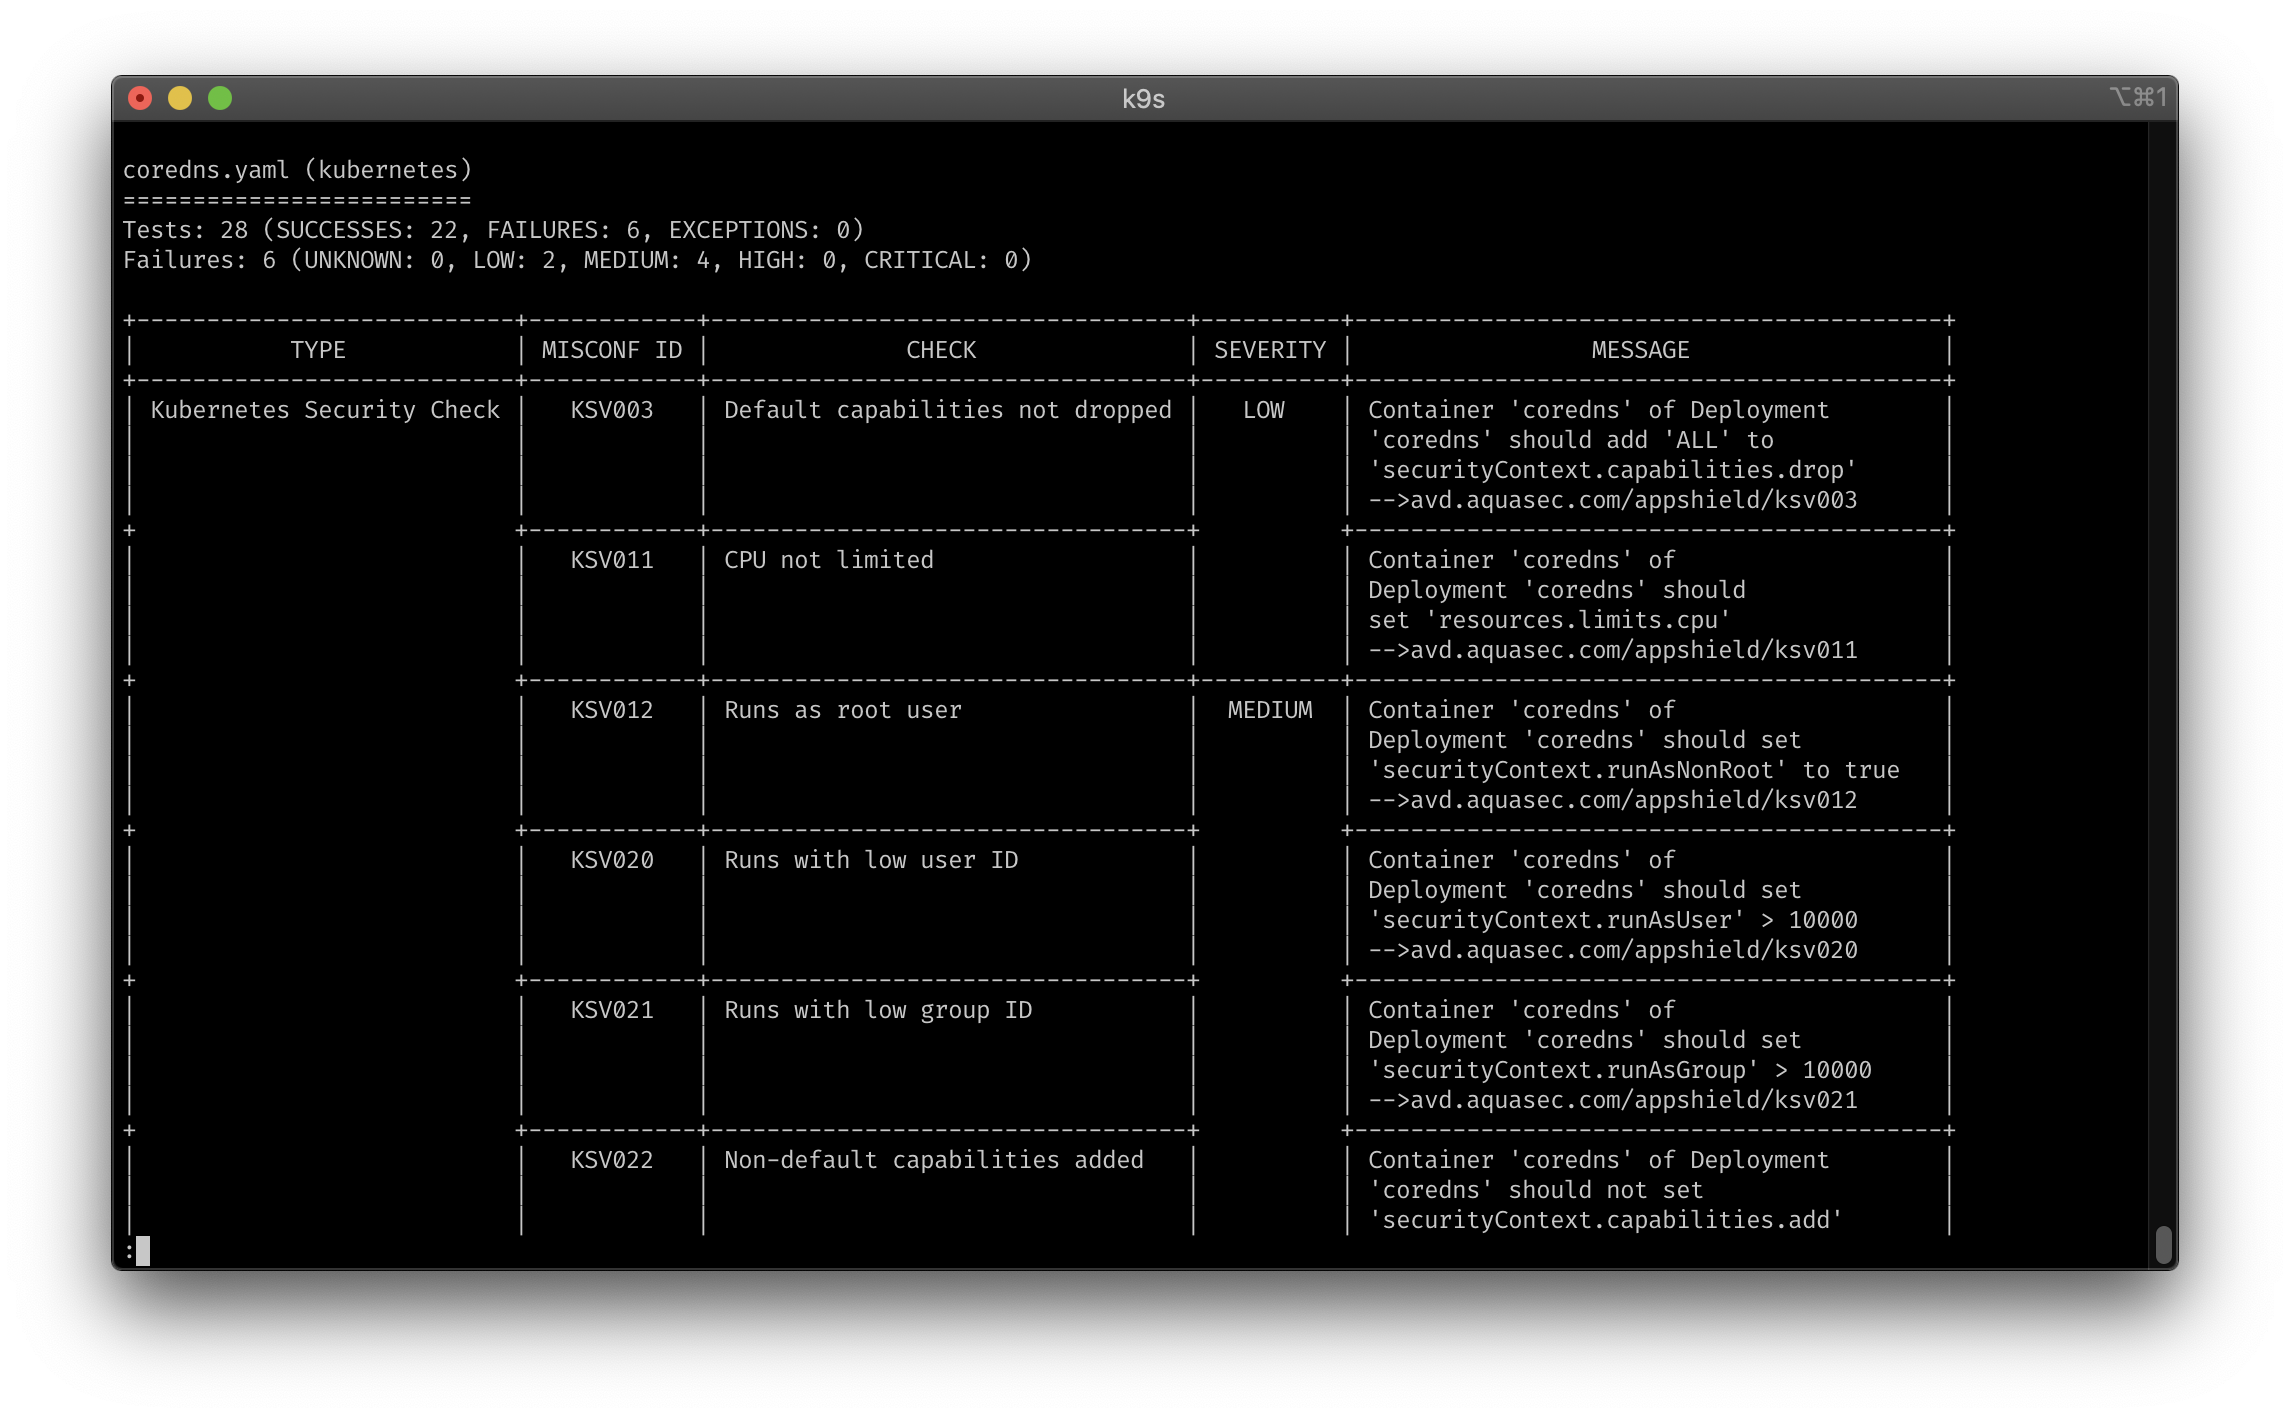
command: shThe new menu options:
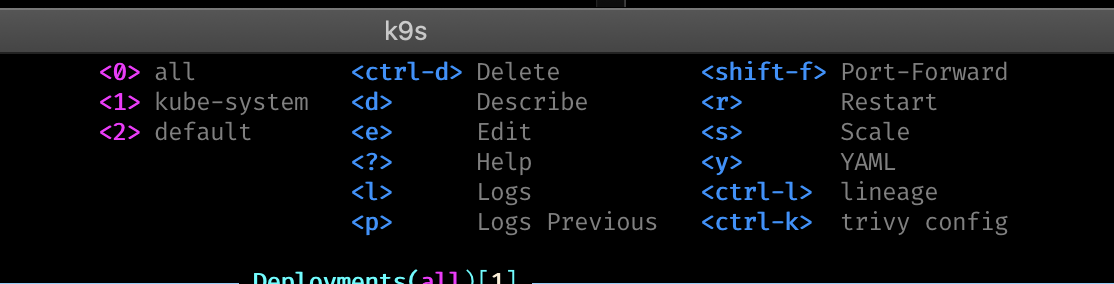
Trivy config scan in action:
Trivy image and sbom scan:
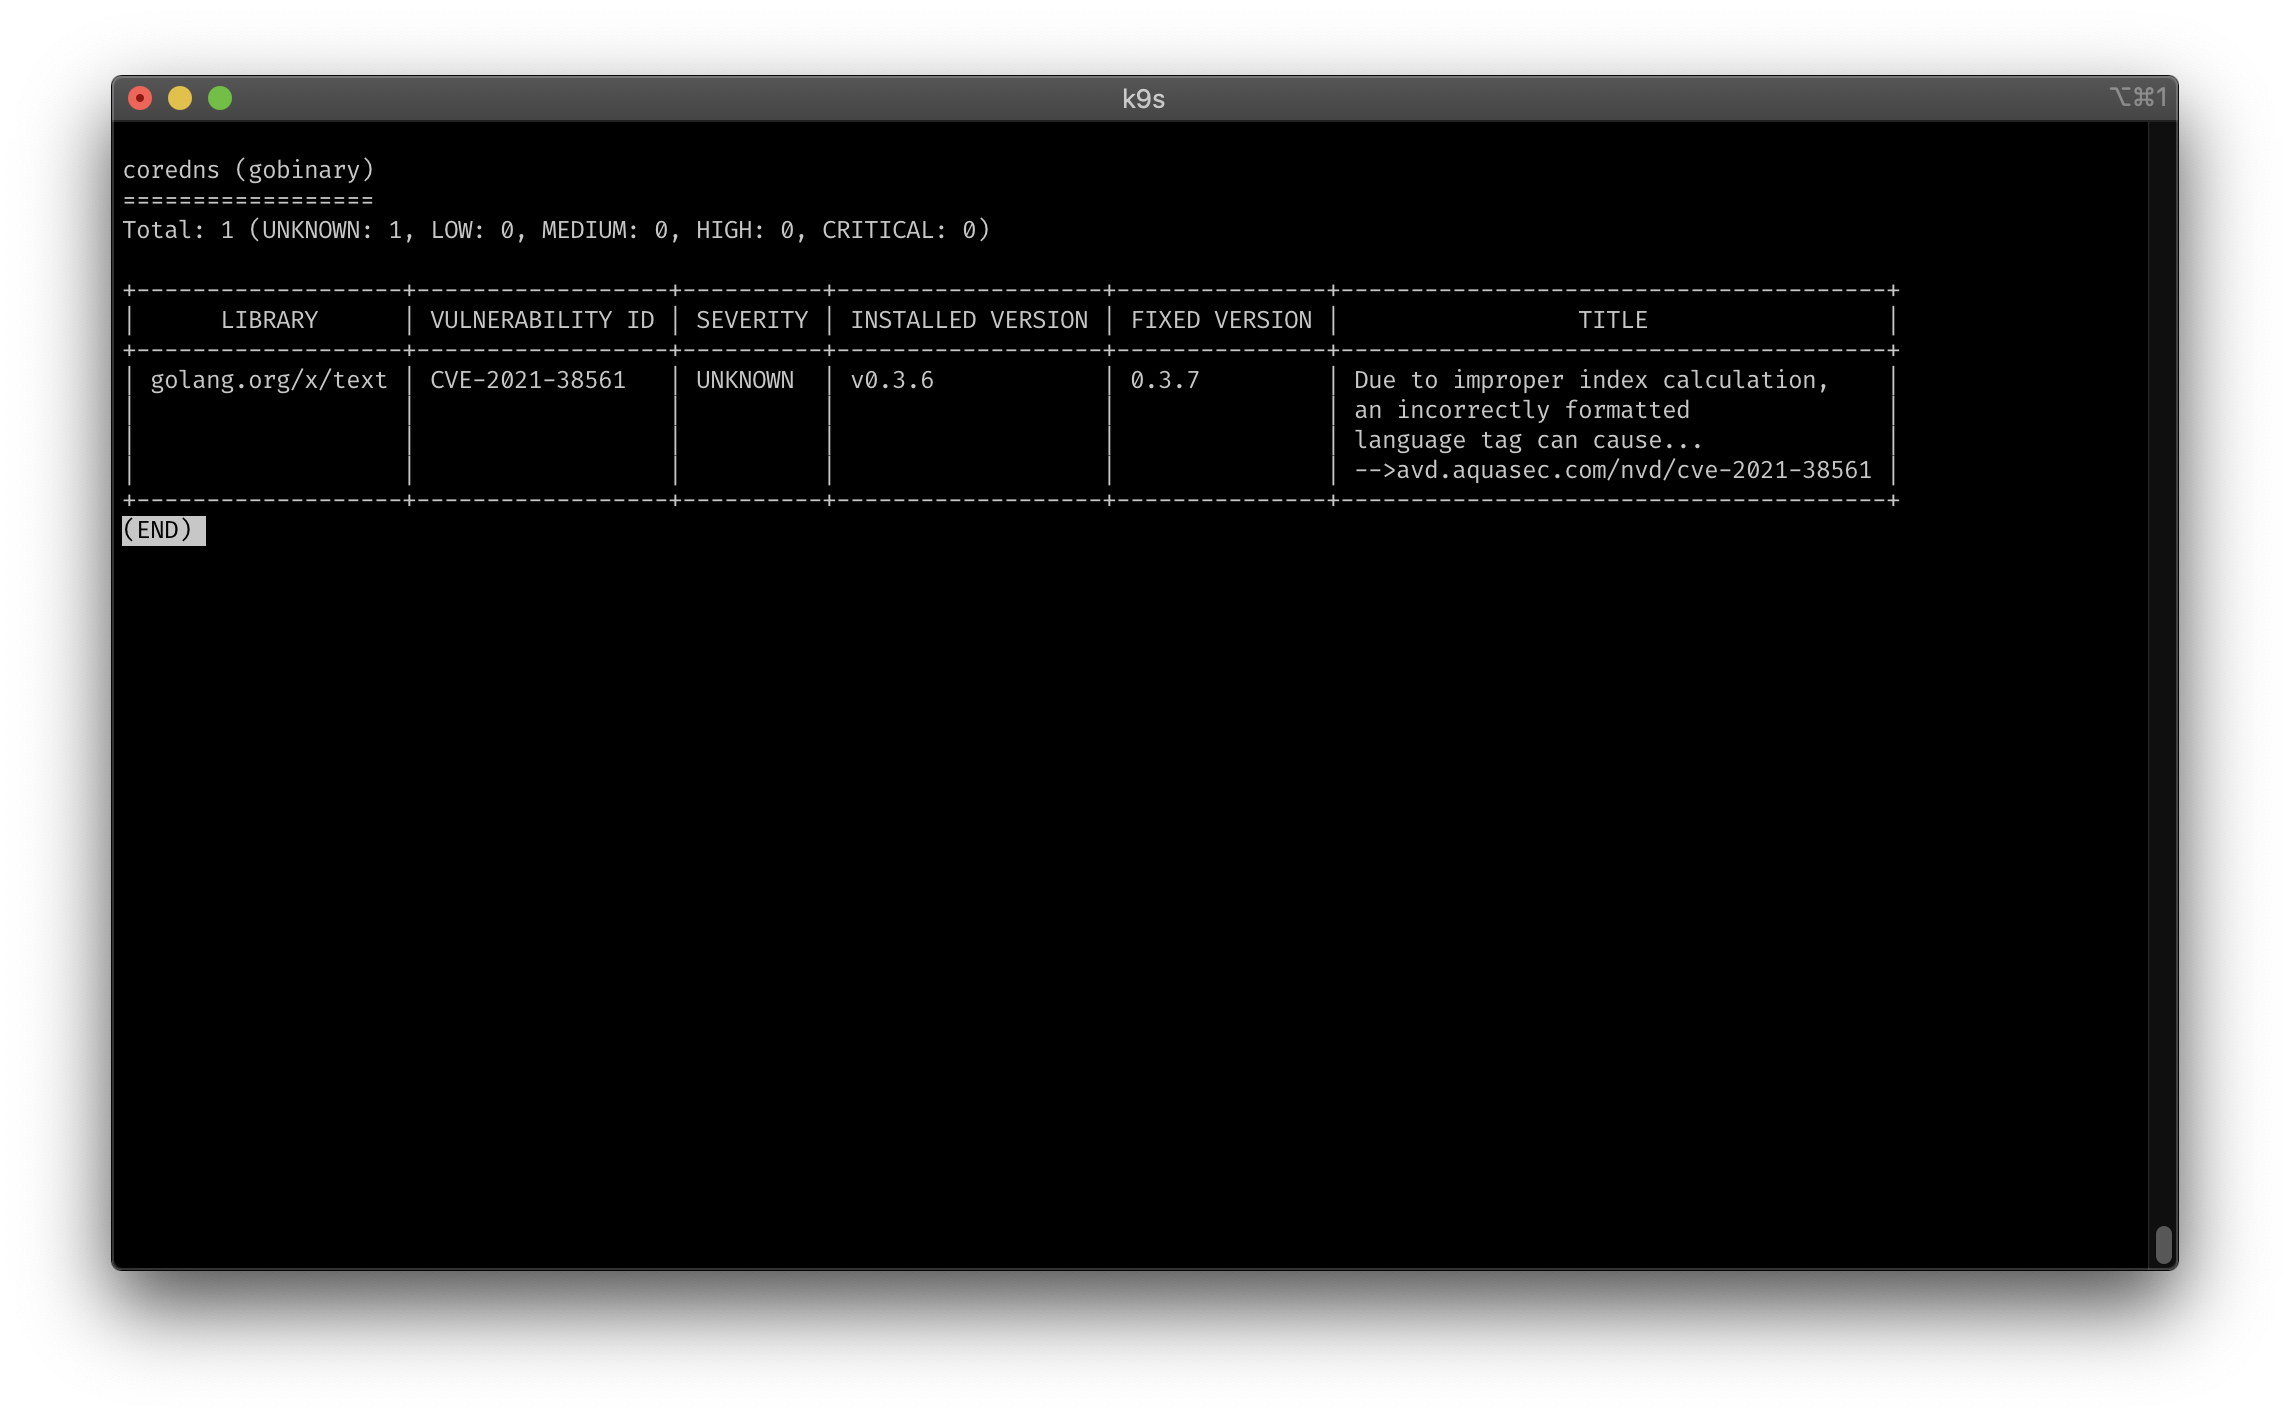
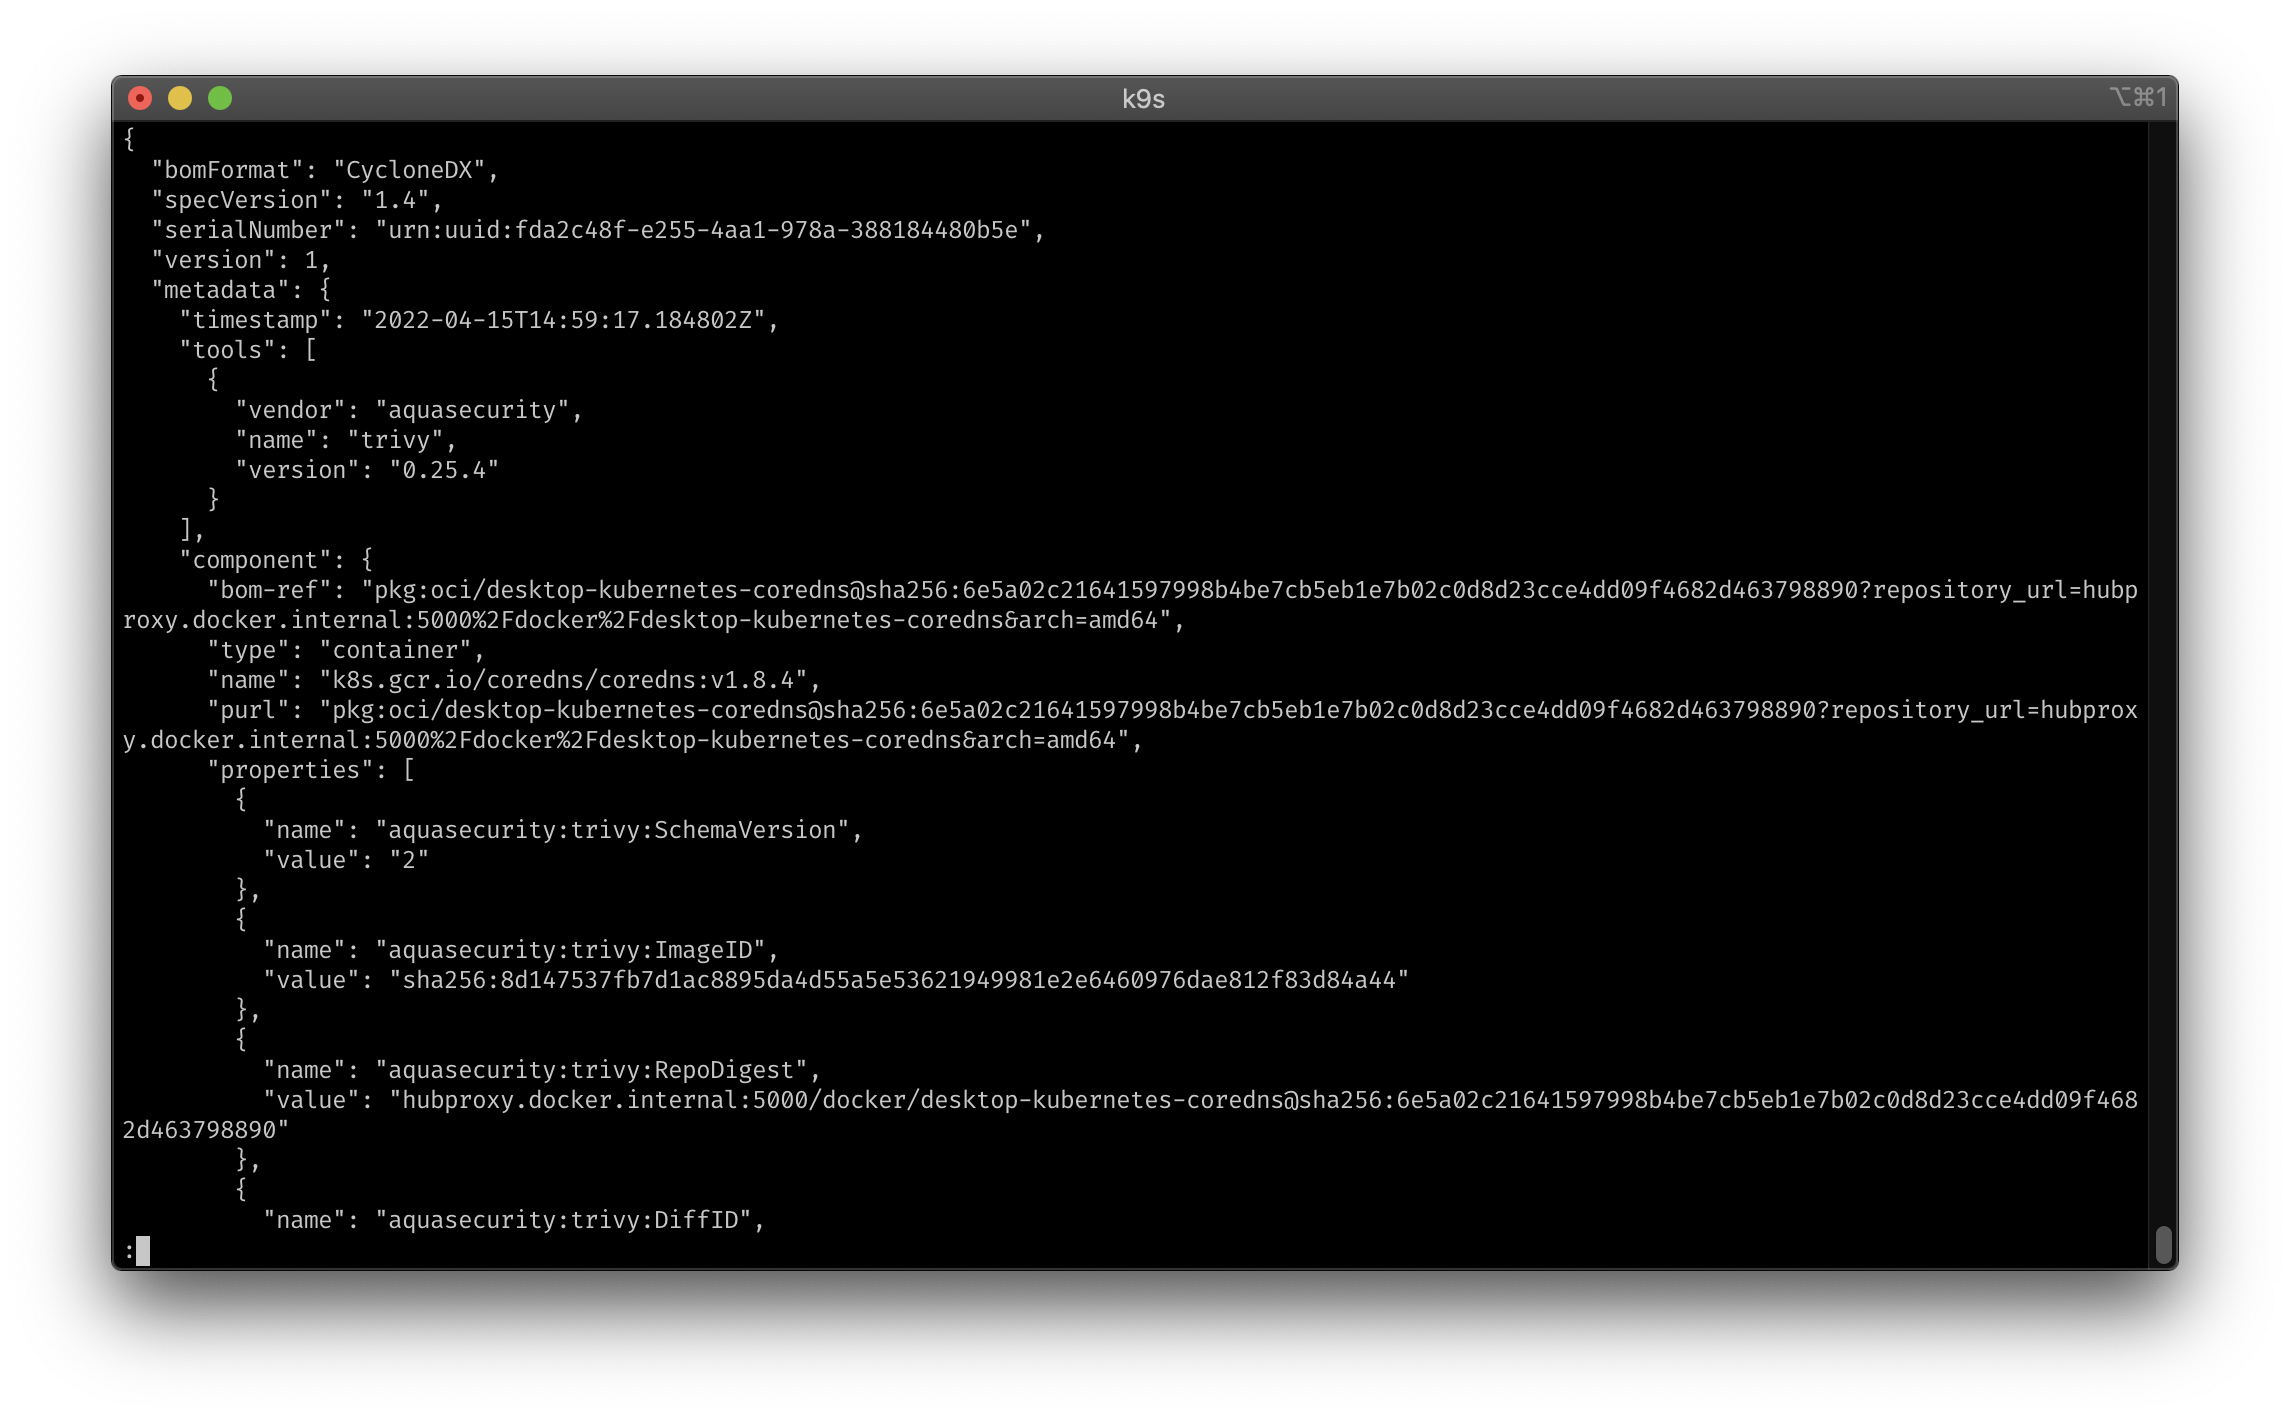
Cosign verification:
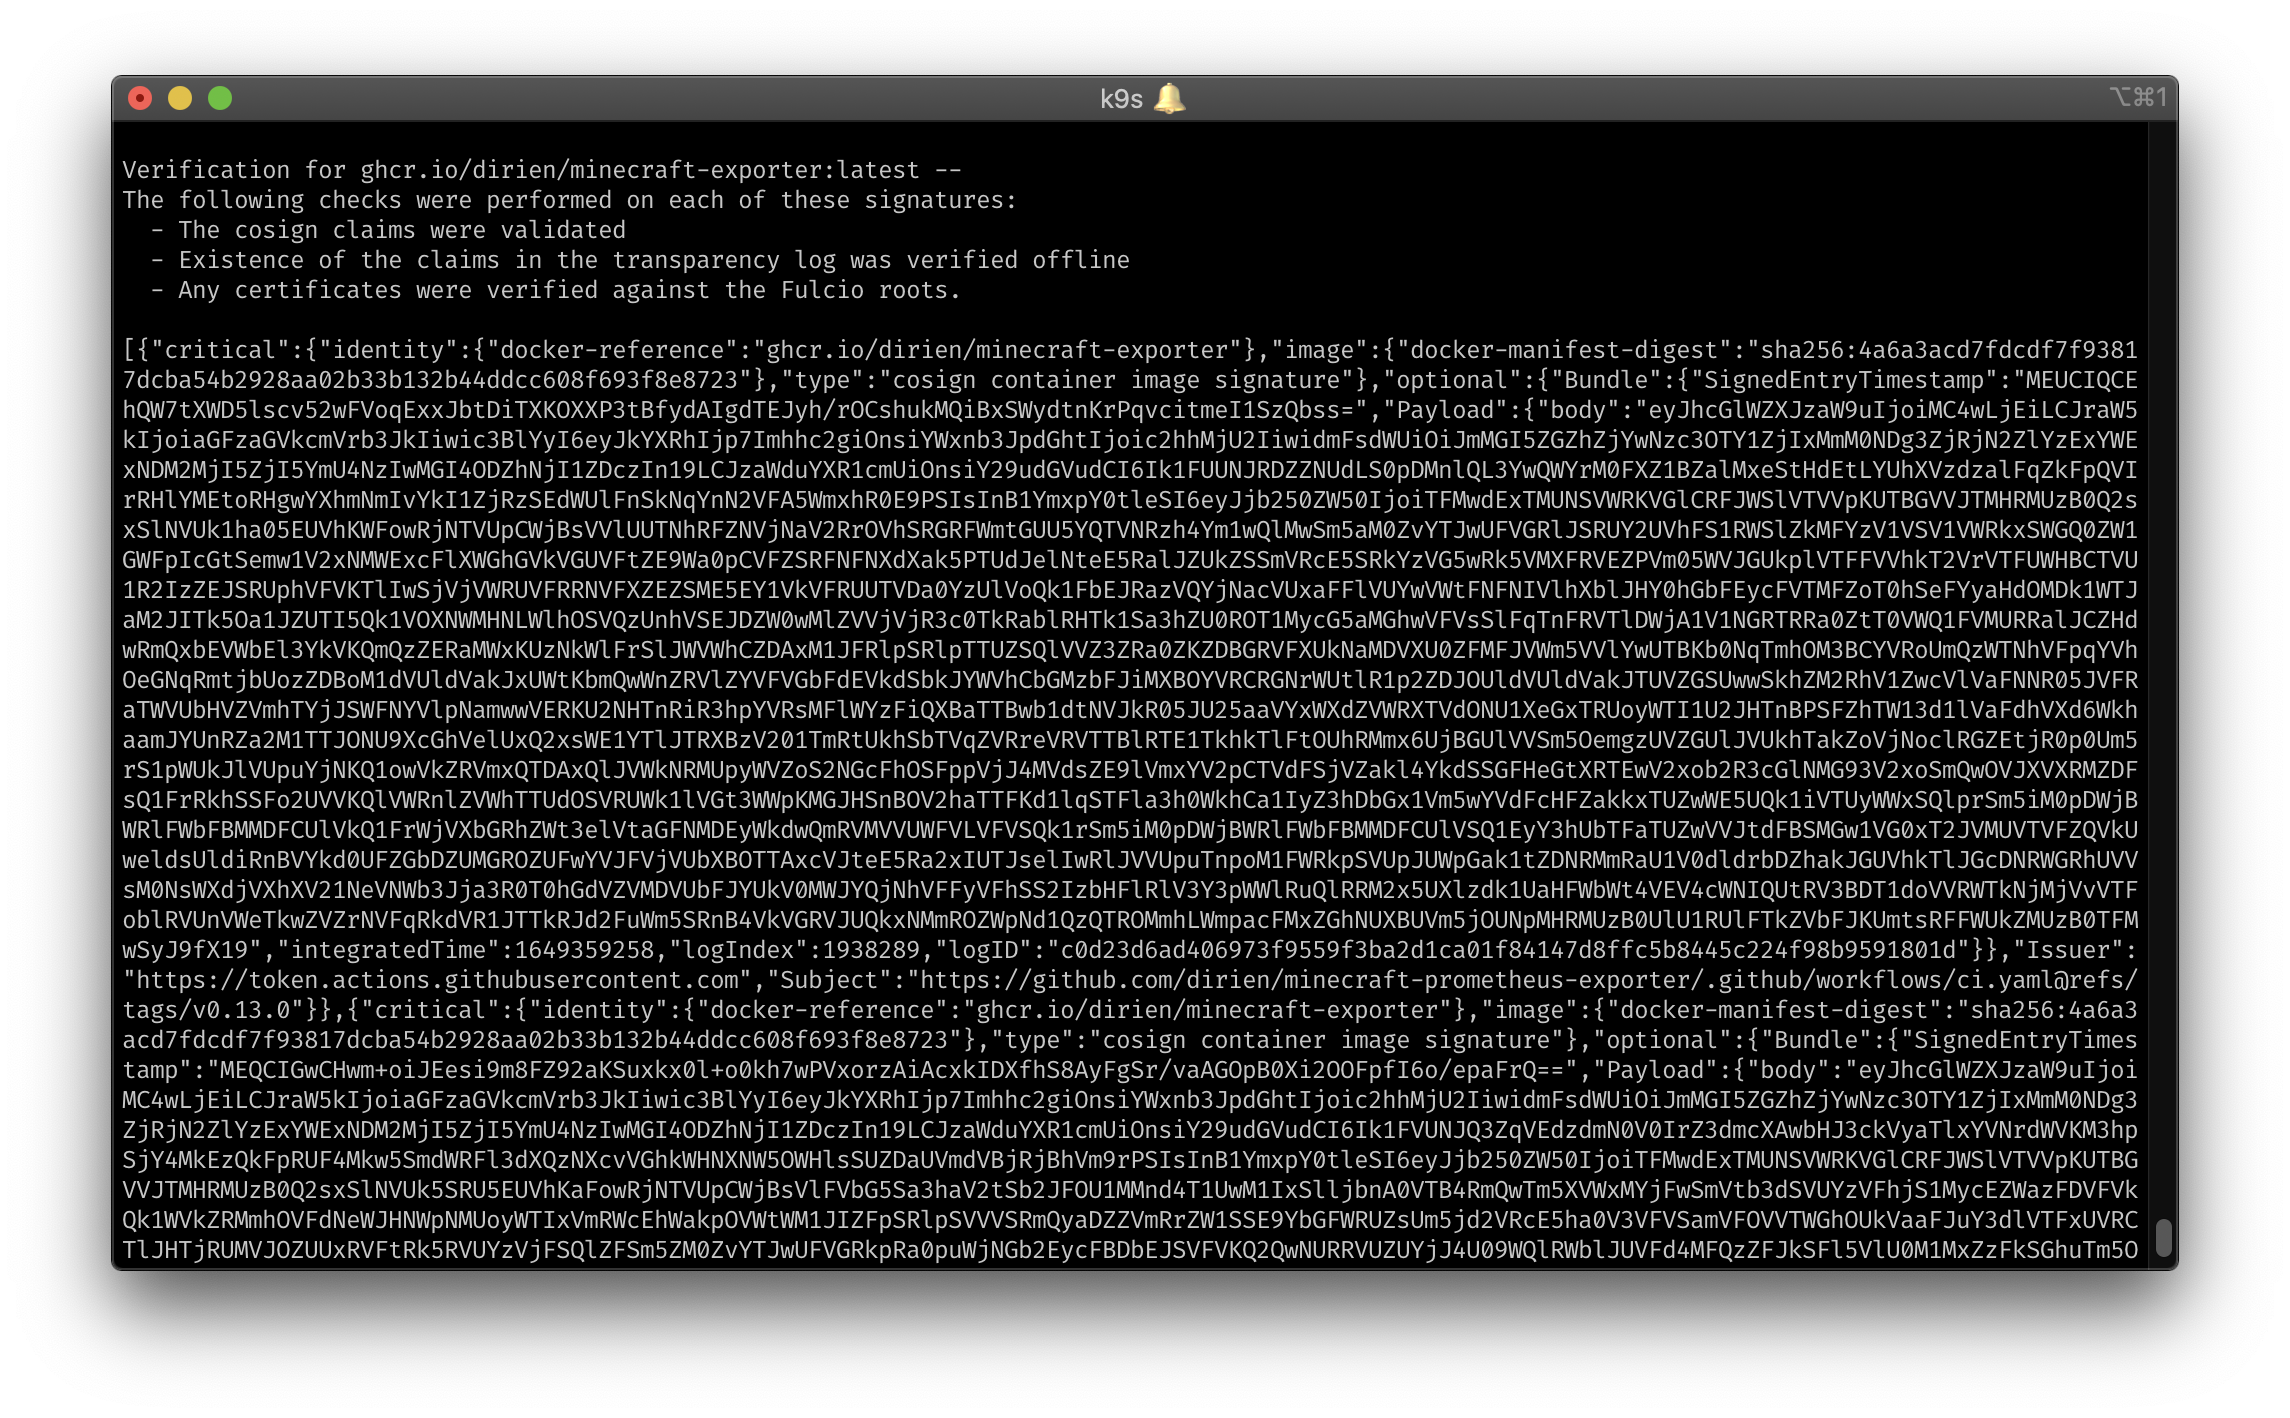
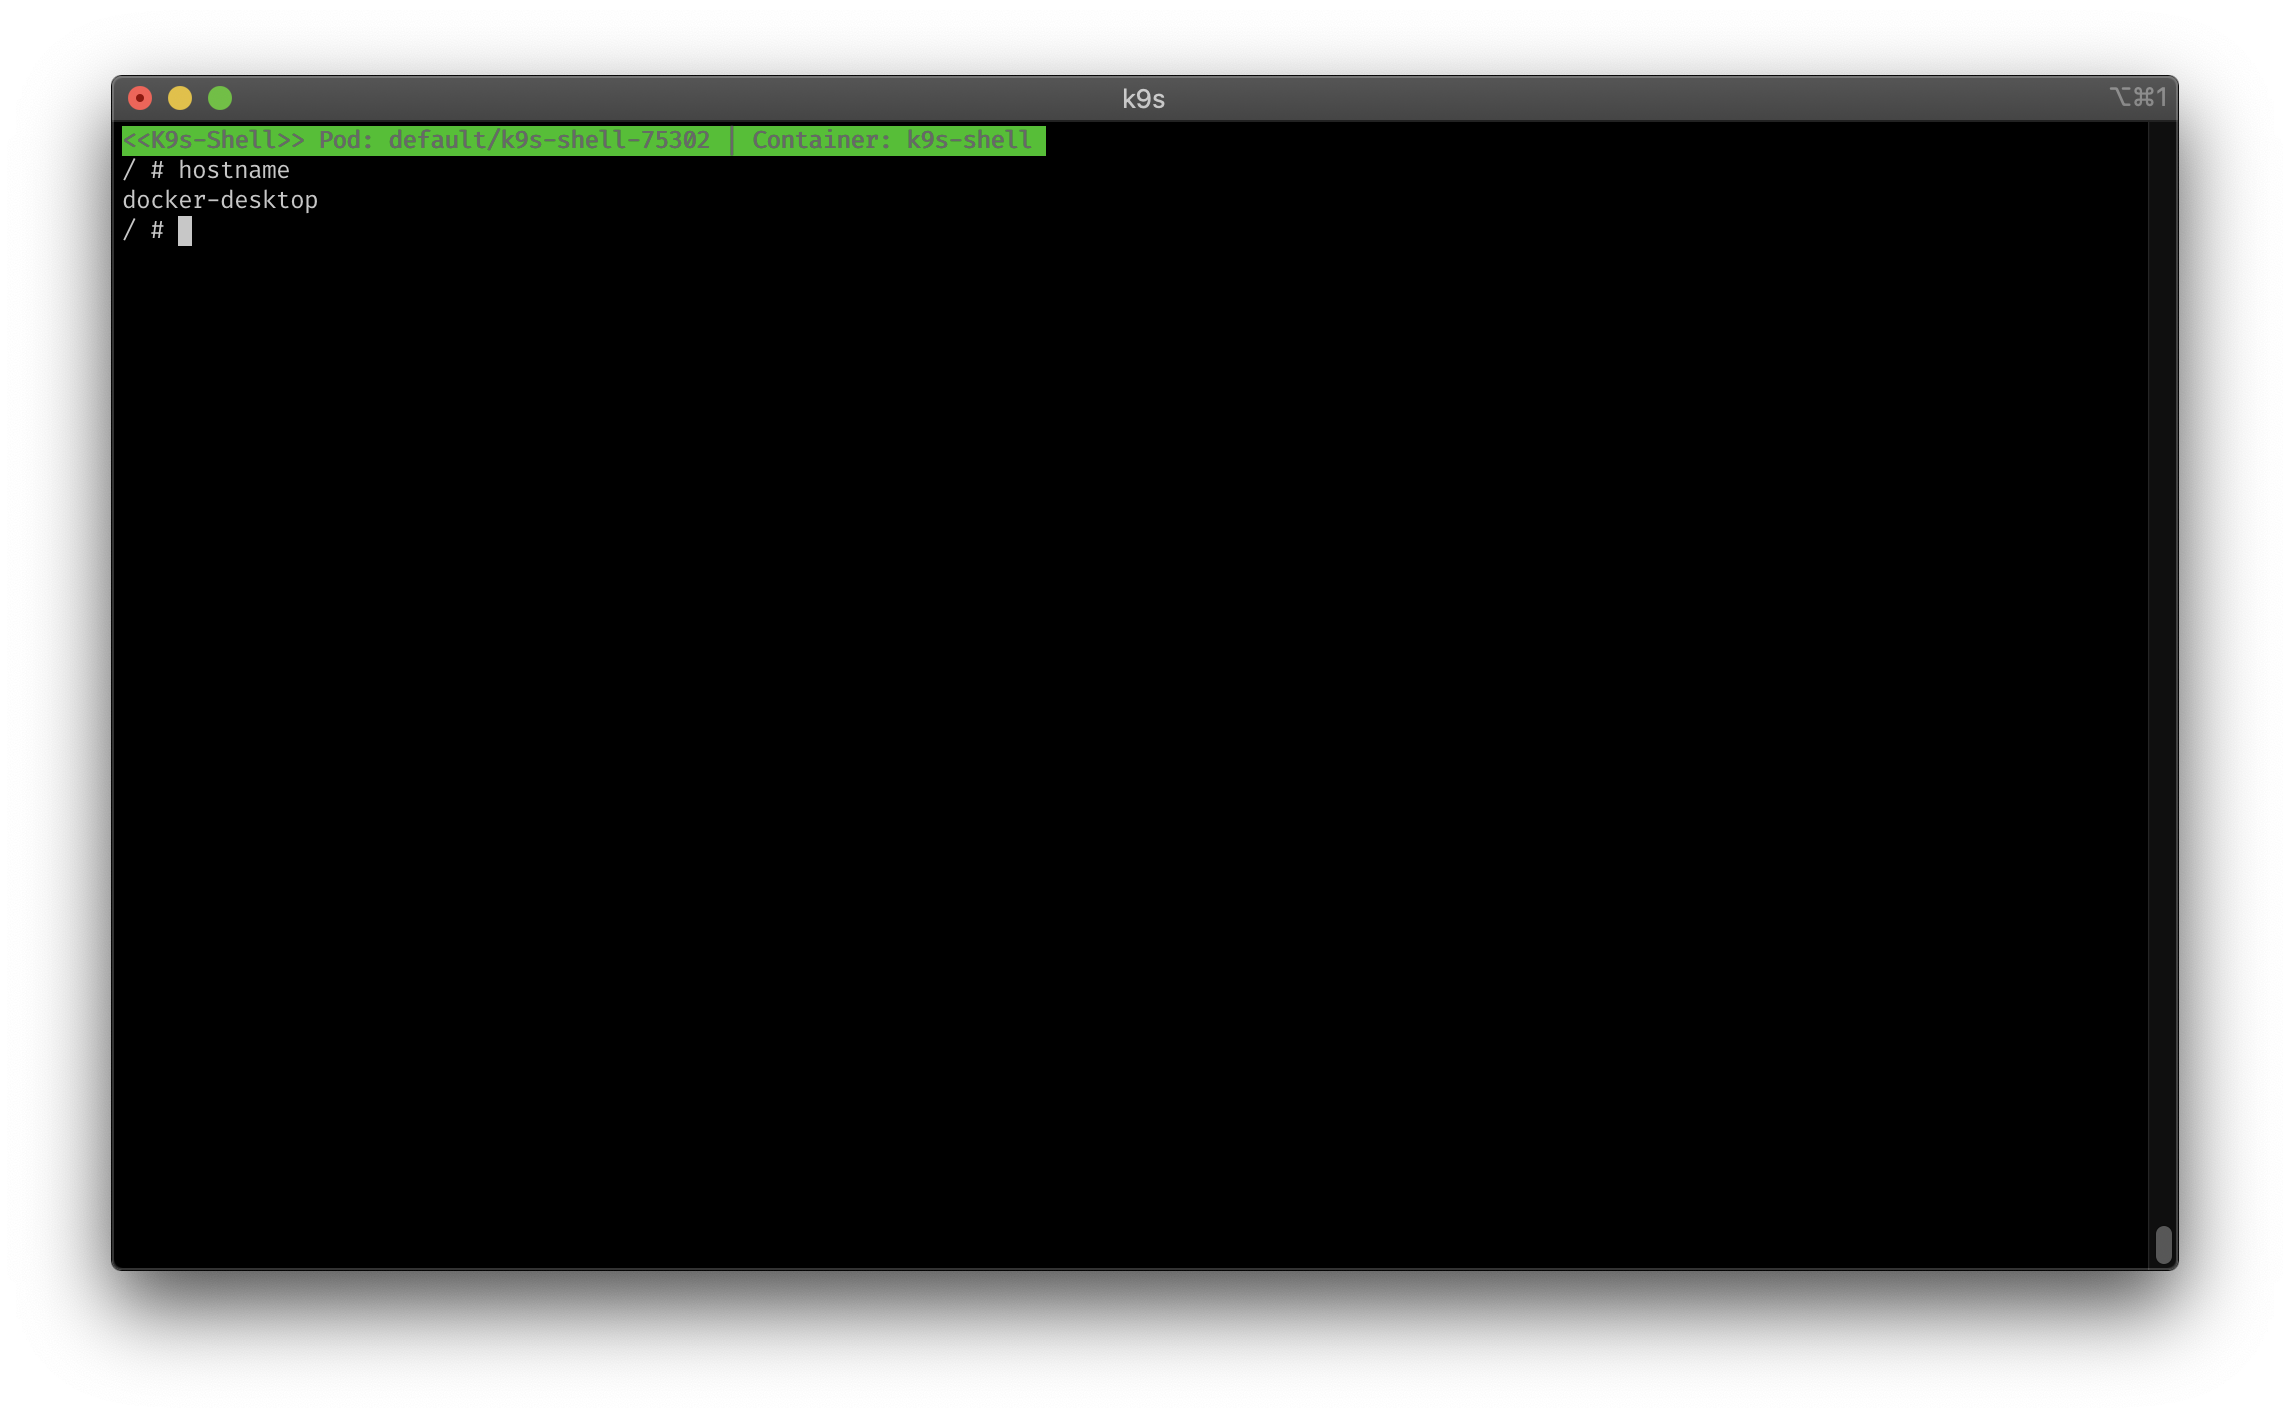
NodeShell support #
When you enable the nodeShell feature gate on a given cluster, K9s allows you to shell into your cluster nodes. The moment you enable the feature, you get a new s menu option in the node view. What K9s is doing, is that it will launch a pod on this node.
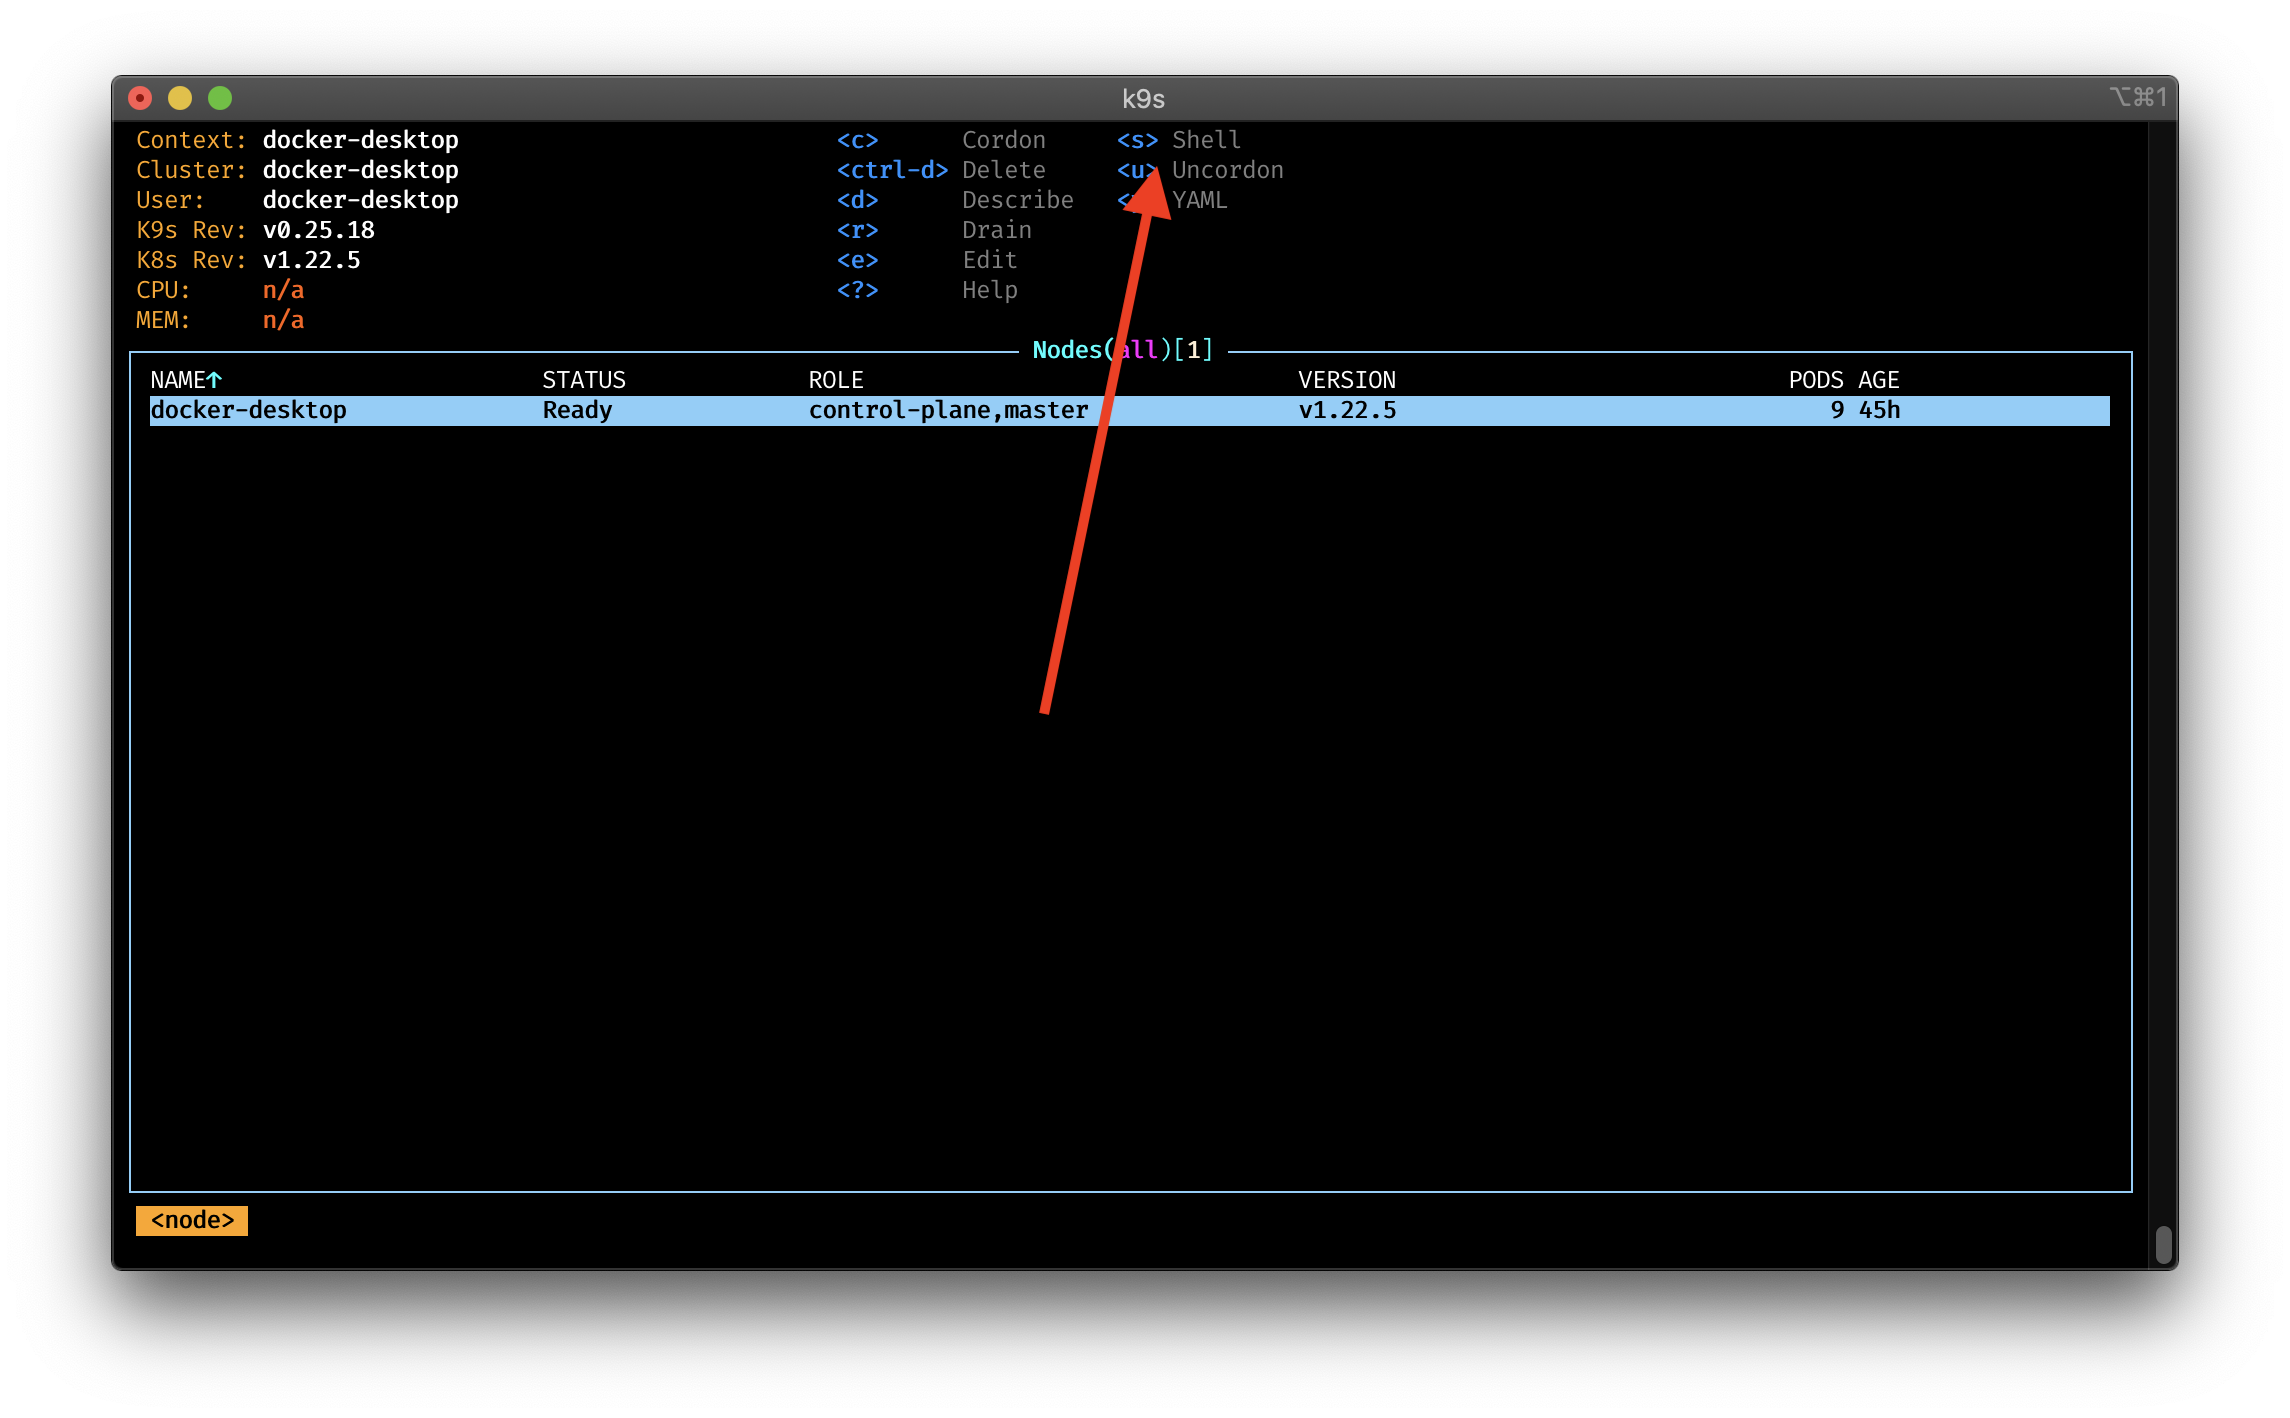
You can even define the which container image you want to start. Especially useful when you have your own container with the shell tools you prefer.
By default, K9s will use the BusyBox image. Additionally, you can specify commands, args and memory cpu limits for the pod.
clusters:
  docker-desktop:
    namespace:
      active: all
      favorites:
        - kube-system
        - all
        - default
    view:
      active: node
    featureGates:
      nodeShell: true
    shellPod:
      image: busybox:1.31
      command: [ ]
      args: [ ]
      namespace: default
      limits:
        cpu: 100m
        memory: 100Mi
    portForwardAddress: localhost
Pulse mode #
K9s has a special mode called pulse that allows you to monitor your cluster in real time.
With following commands, you can start the pulse mode:
:pulse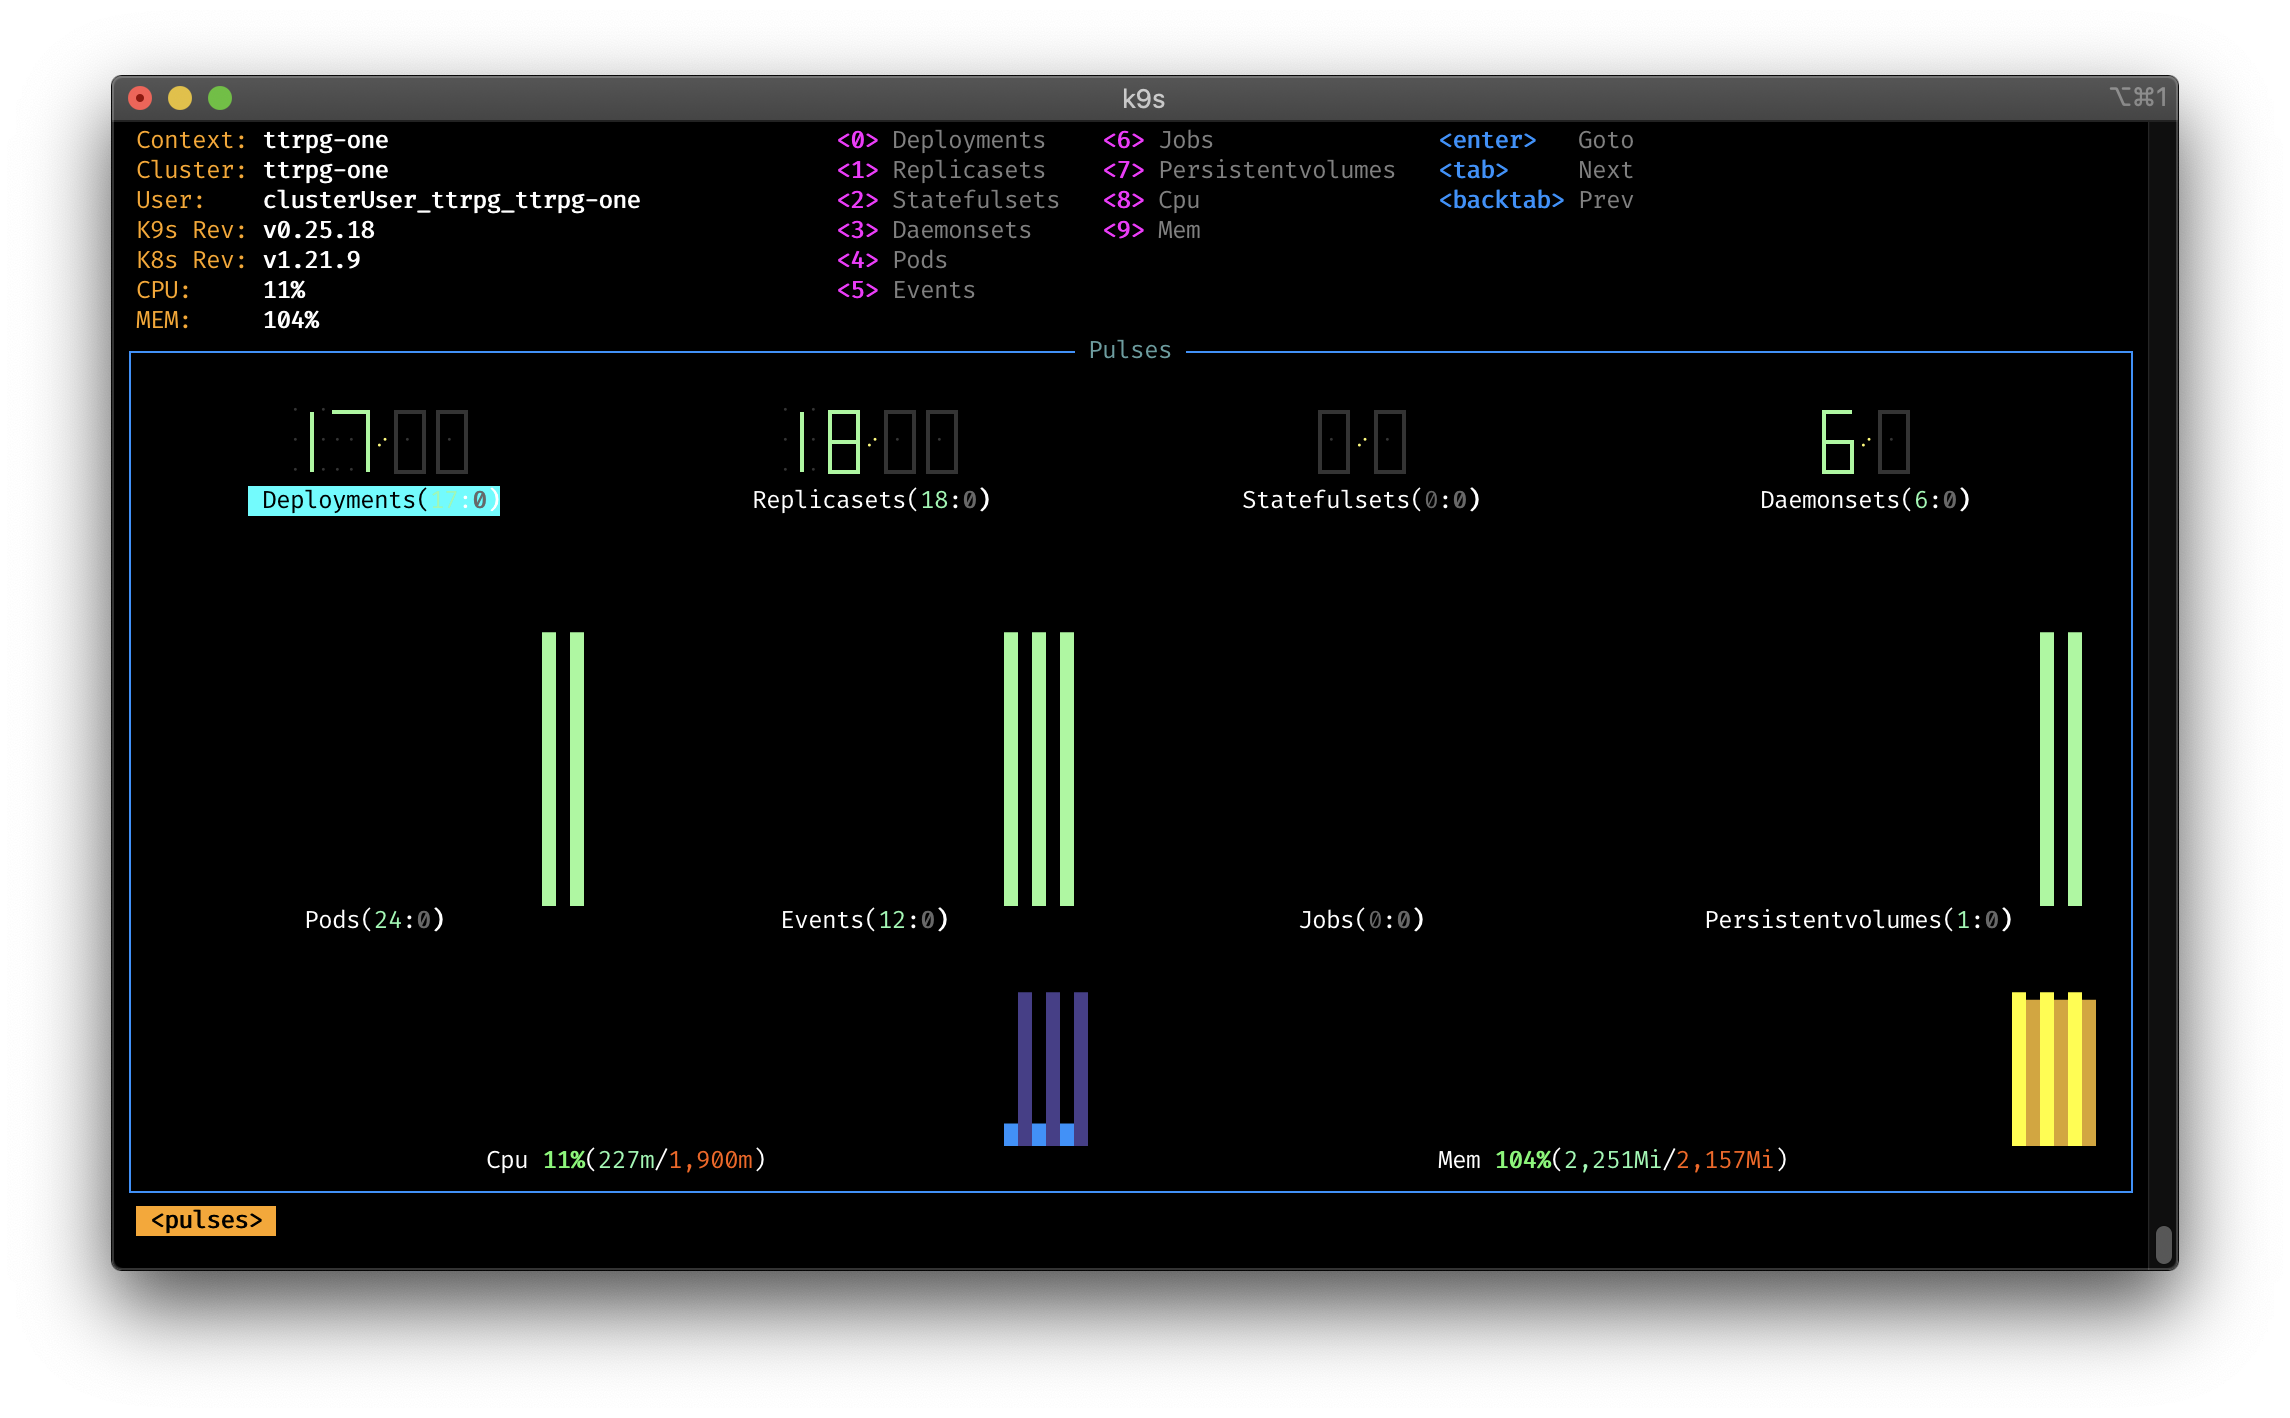
XRay support #
The XRay feature is very useful to give you inside to your cluster resources and their dependencies.
Just type following command to start the XRay mode:
:xray <ressource>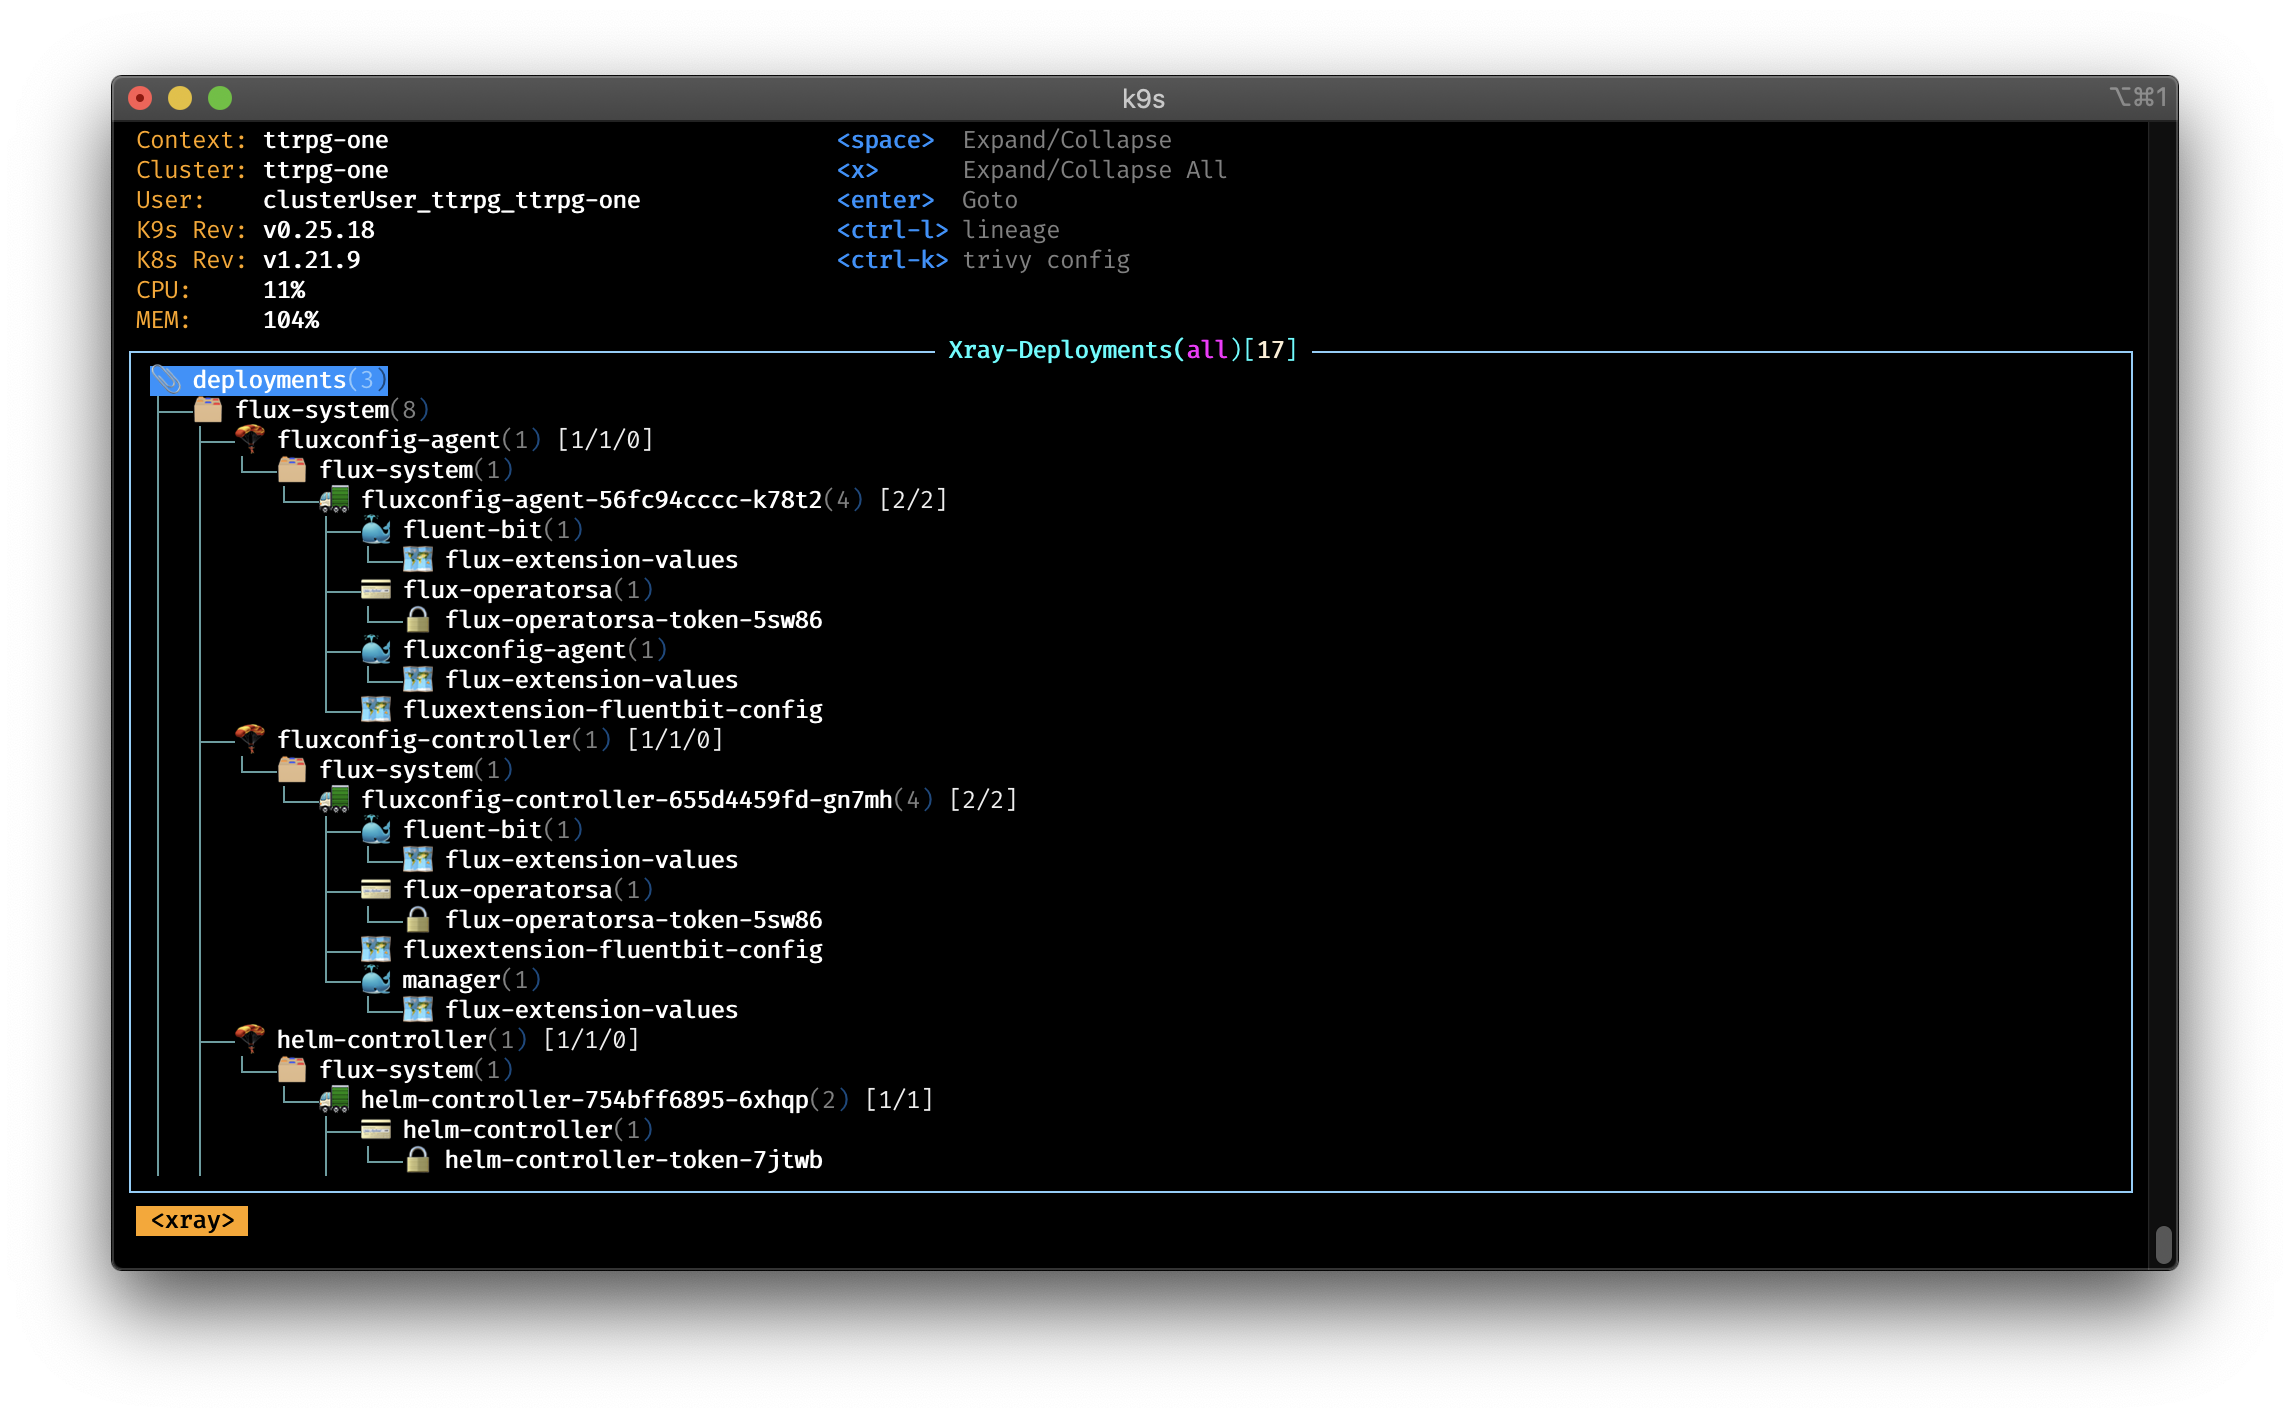
Allowed resources are: Deployment, Pod and StatefulSet.
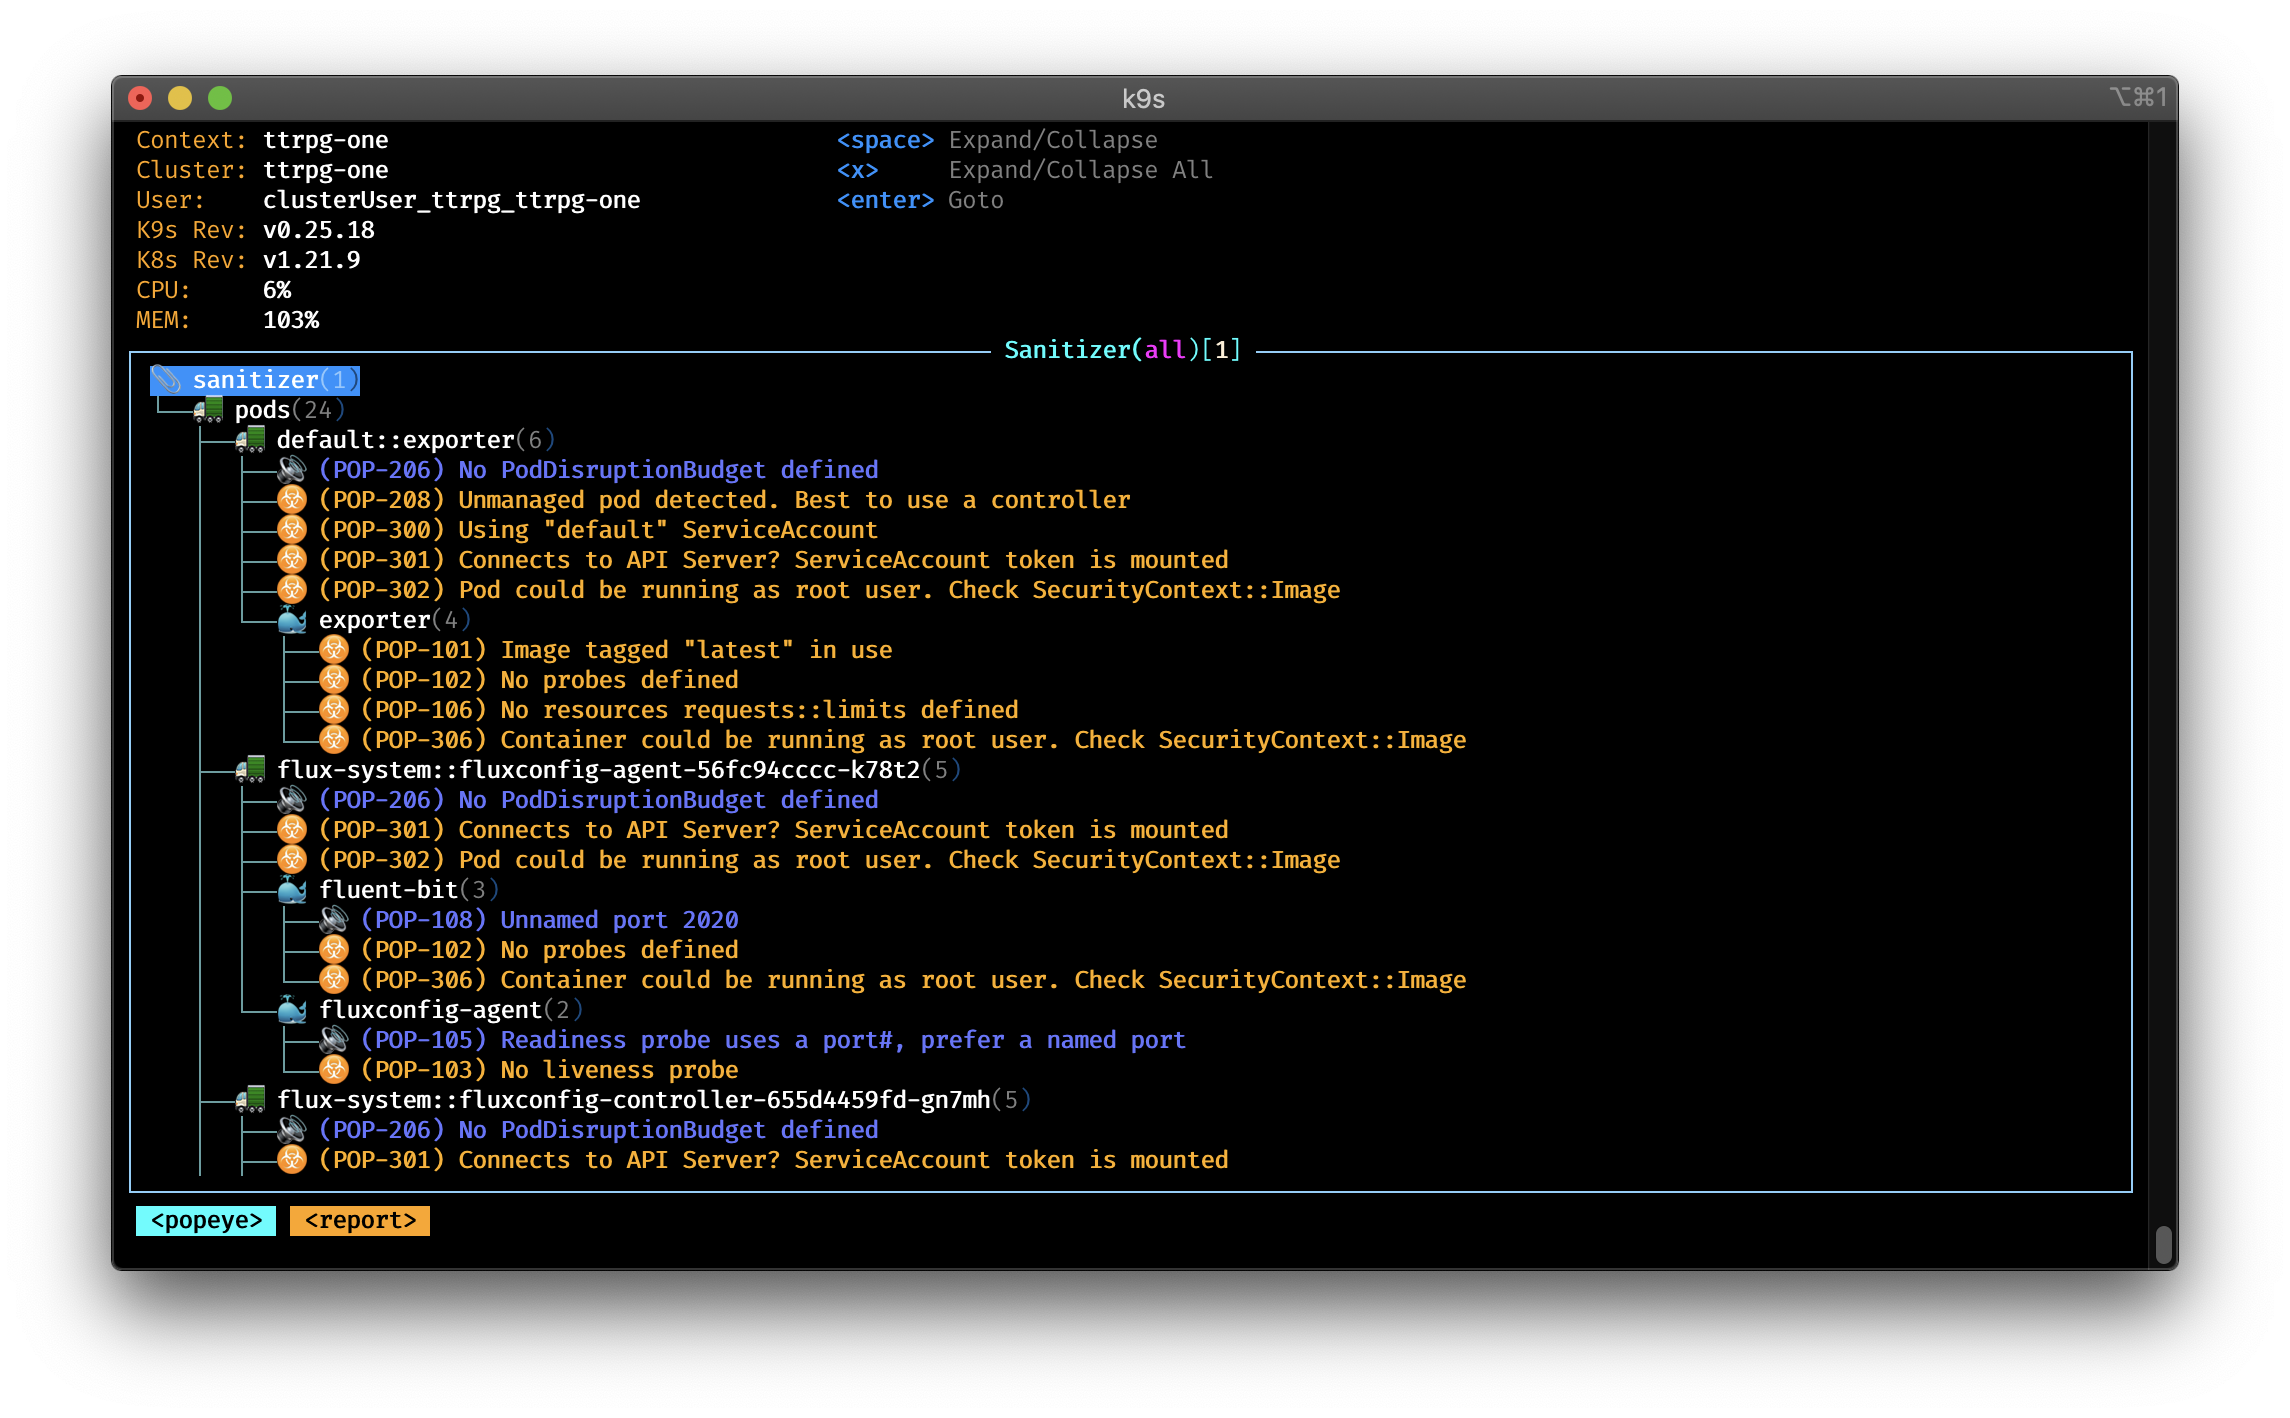
The Popeye Mode: An Inbuilt k8s Cluster Sanitizer #
K9s has a special mode called popeye that allows you to scan your Kubernetes cluster and reports potential issues with deployed resources and configurations. You get feedback for any misconfigurations and helps you to ensure that best practices are in place. On top, it reports potential resources over/under allocations and attempts to warn you should your cluster run out of capacity.
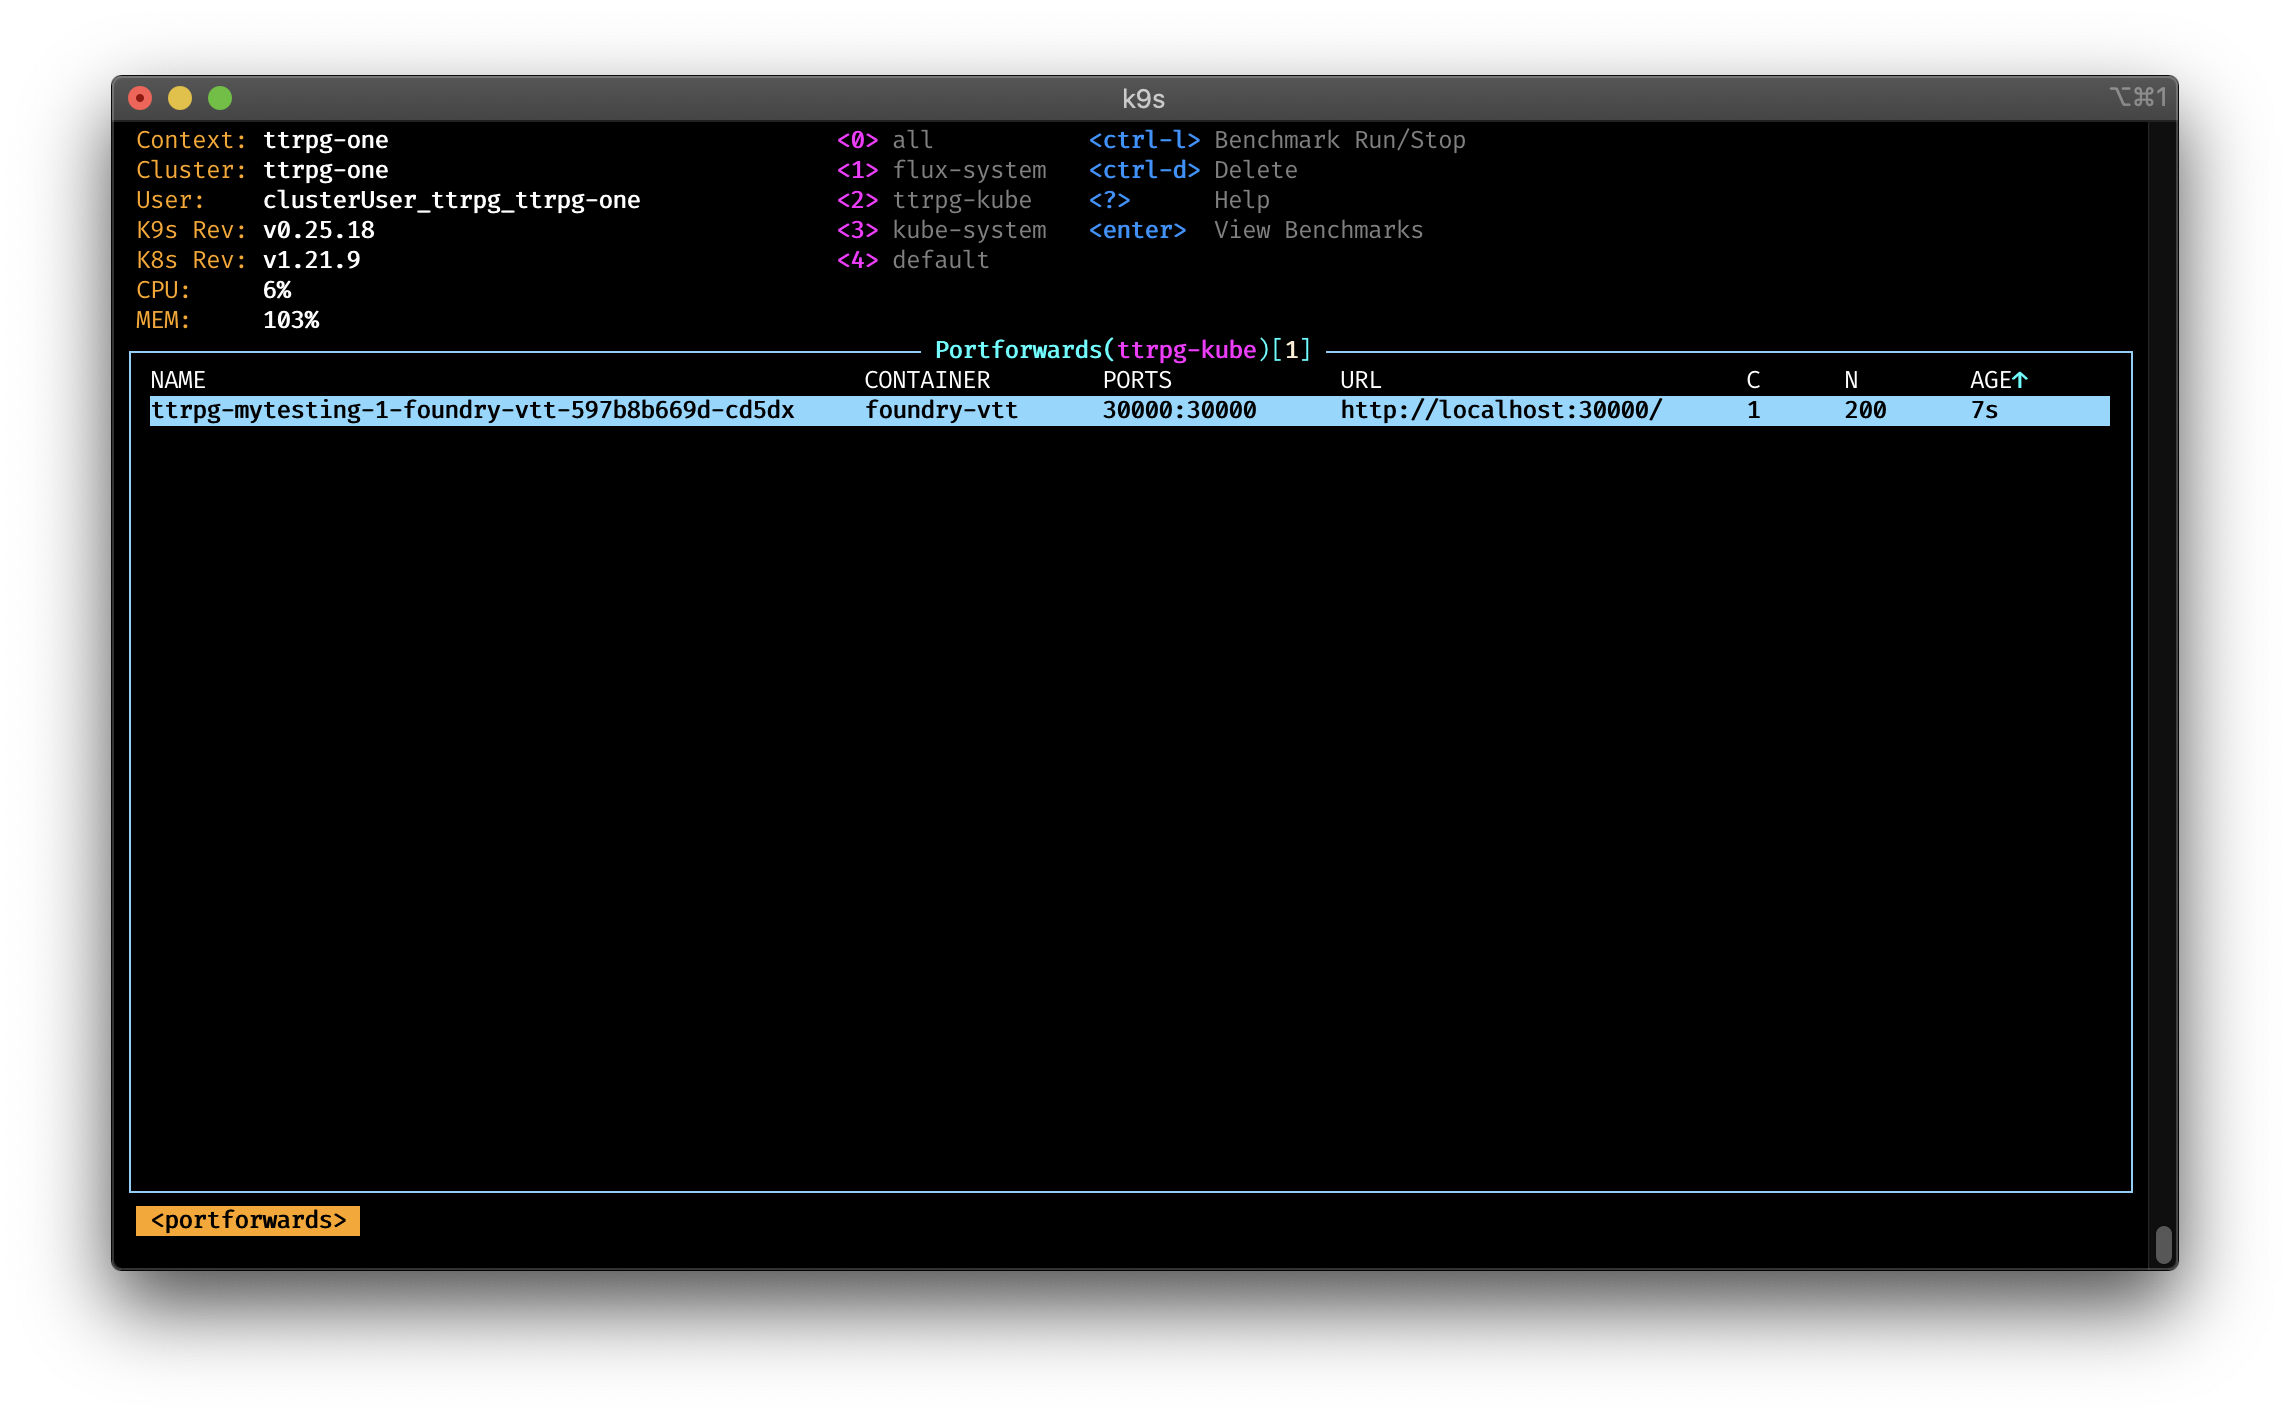
Benchmarking #

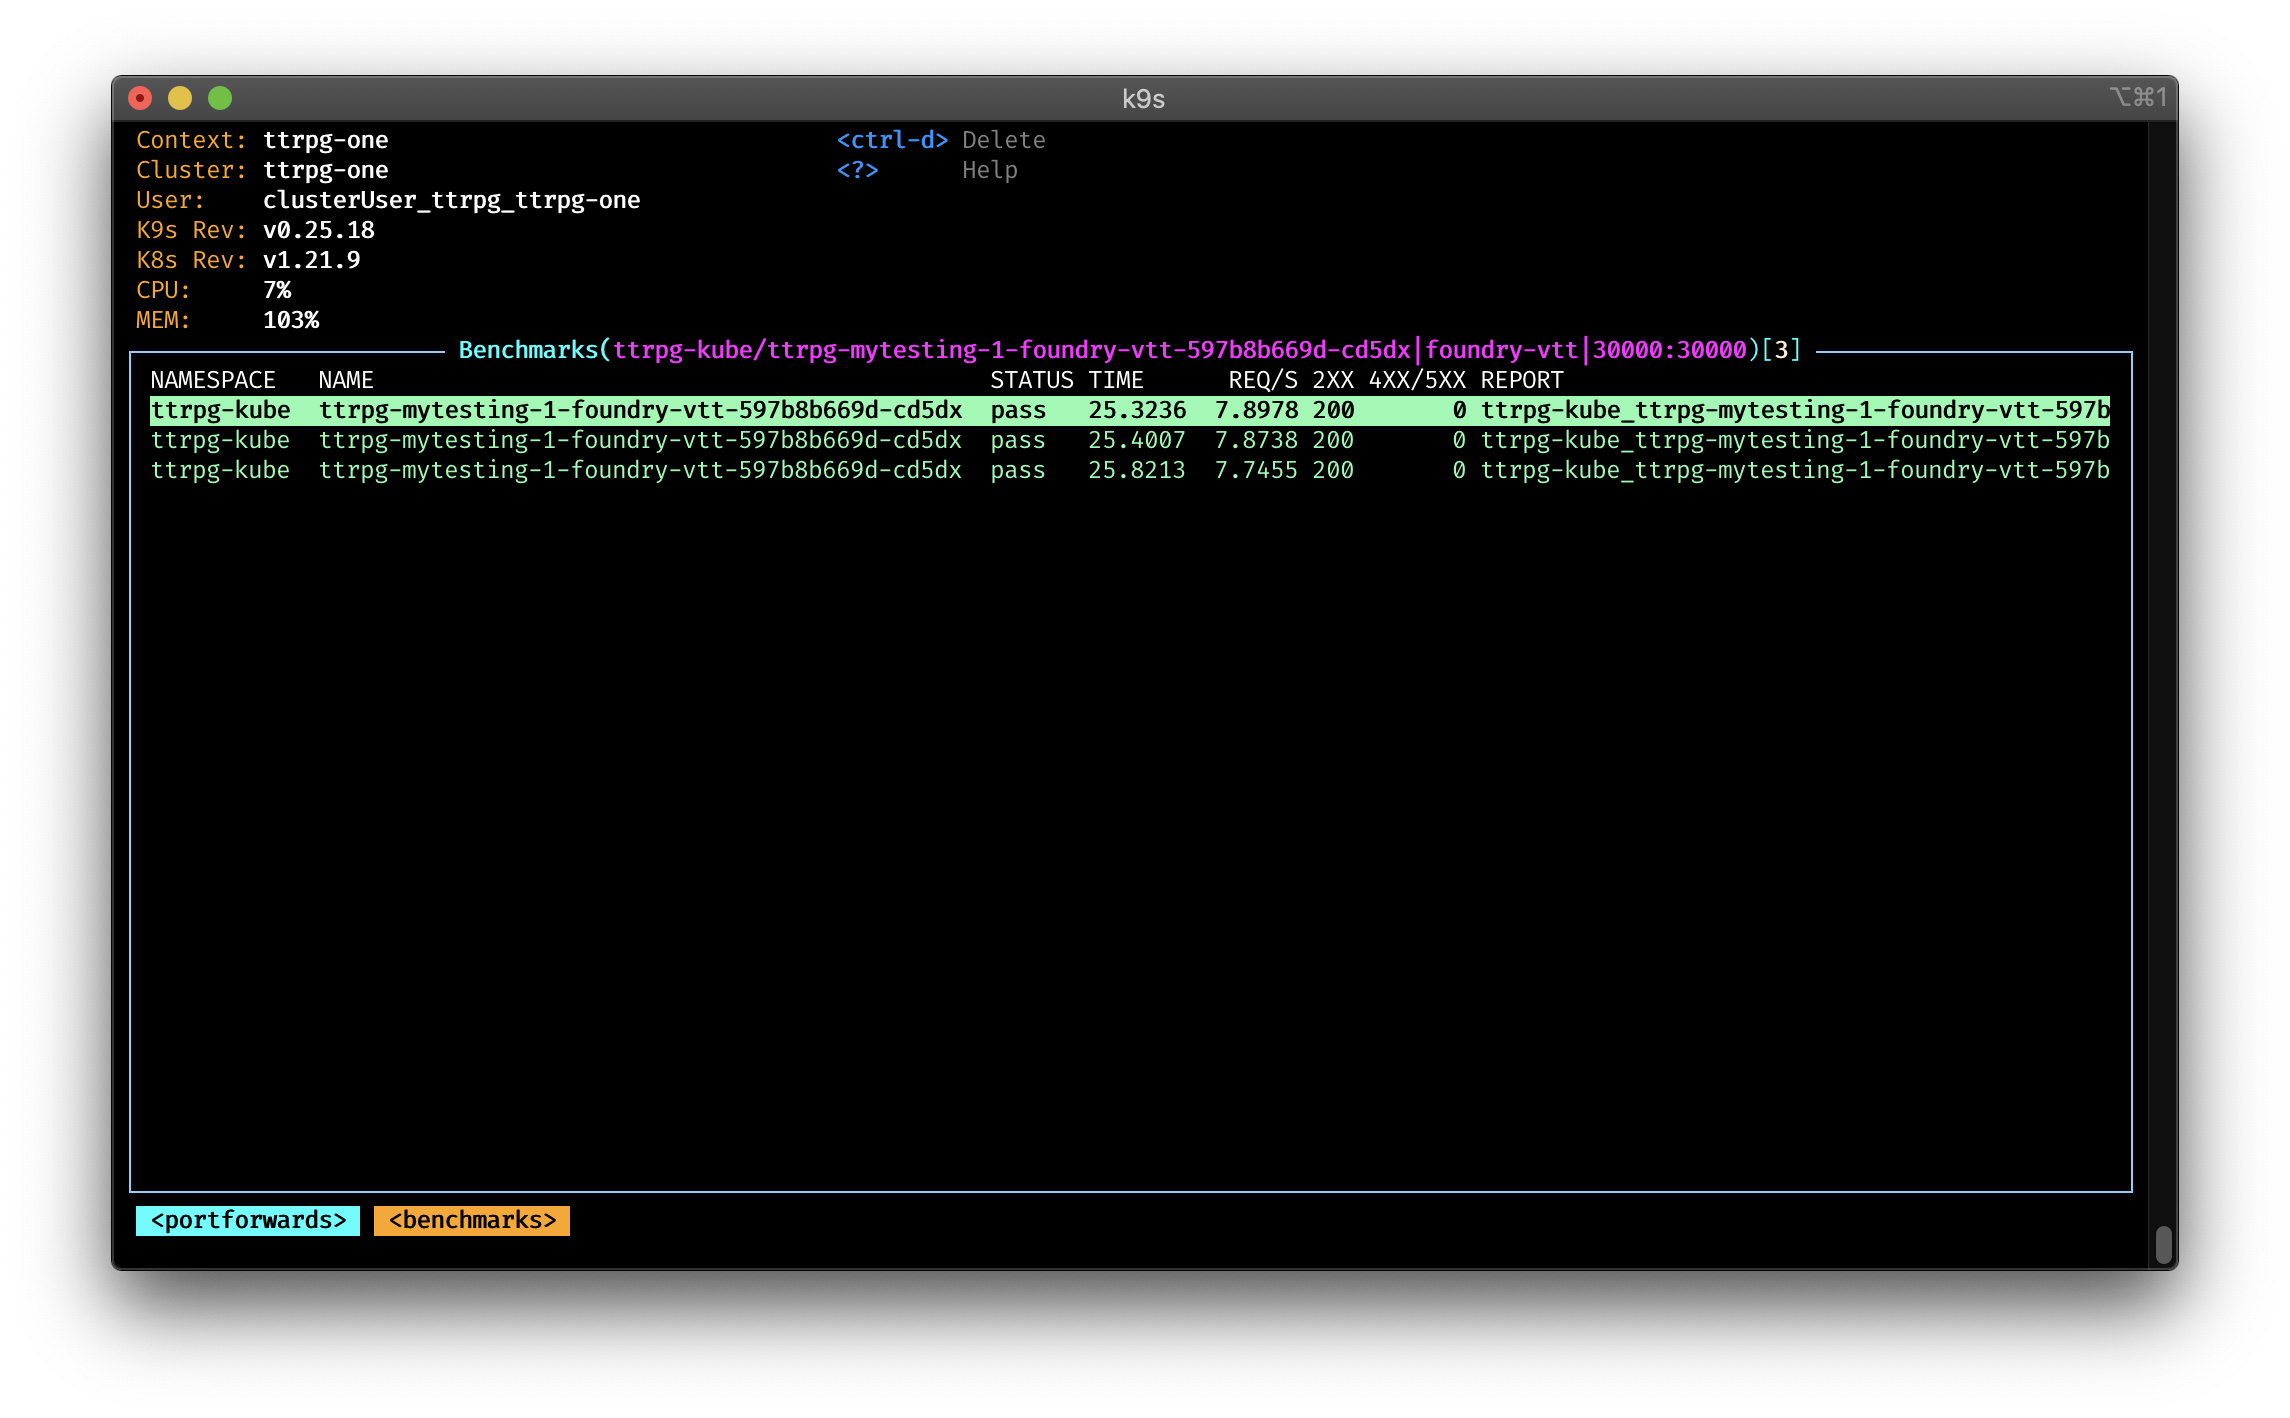
K9s has the ability to benchmark your cluster via an embedded version of hey. All you need to do, is to enable the port-forwarding for your service or container, navigate to the Portforwards view and start the benchmarking via the `Ctrl-l' command.
To see the results of the benchmarking, navigate to the Benchmarking view and press enter to view the results.
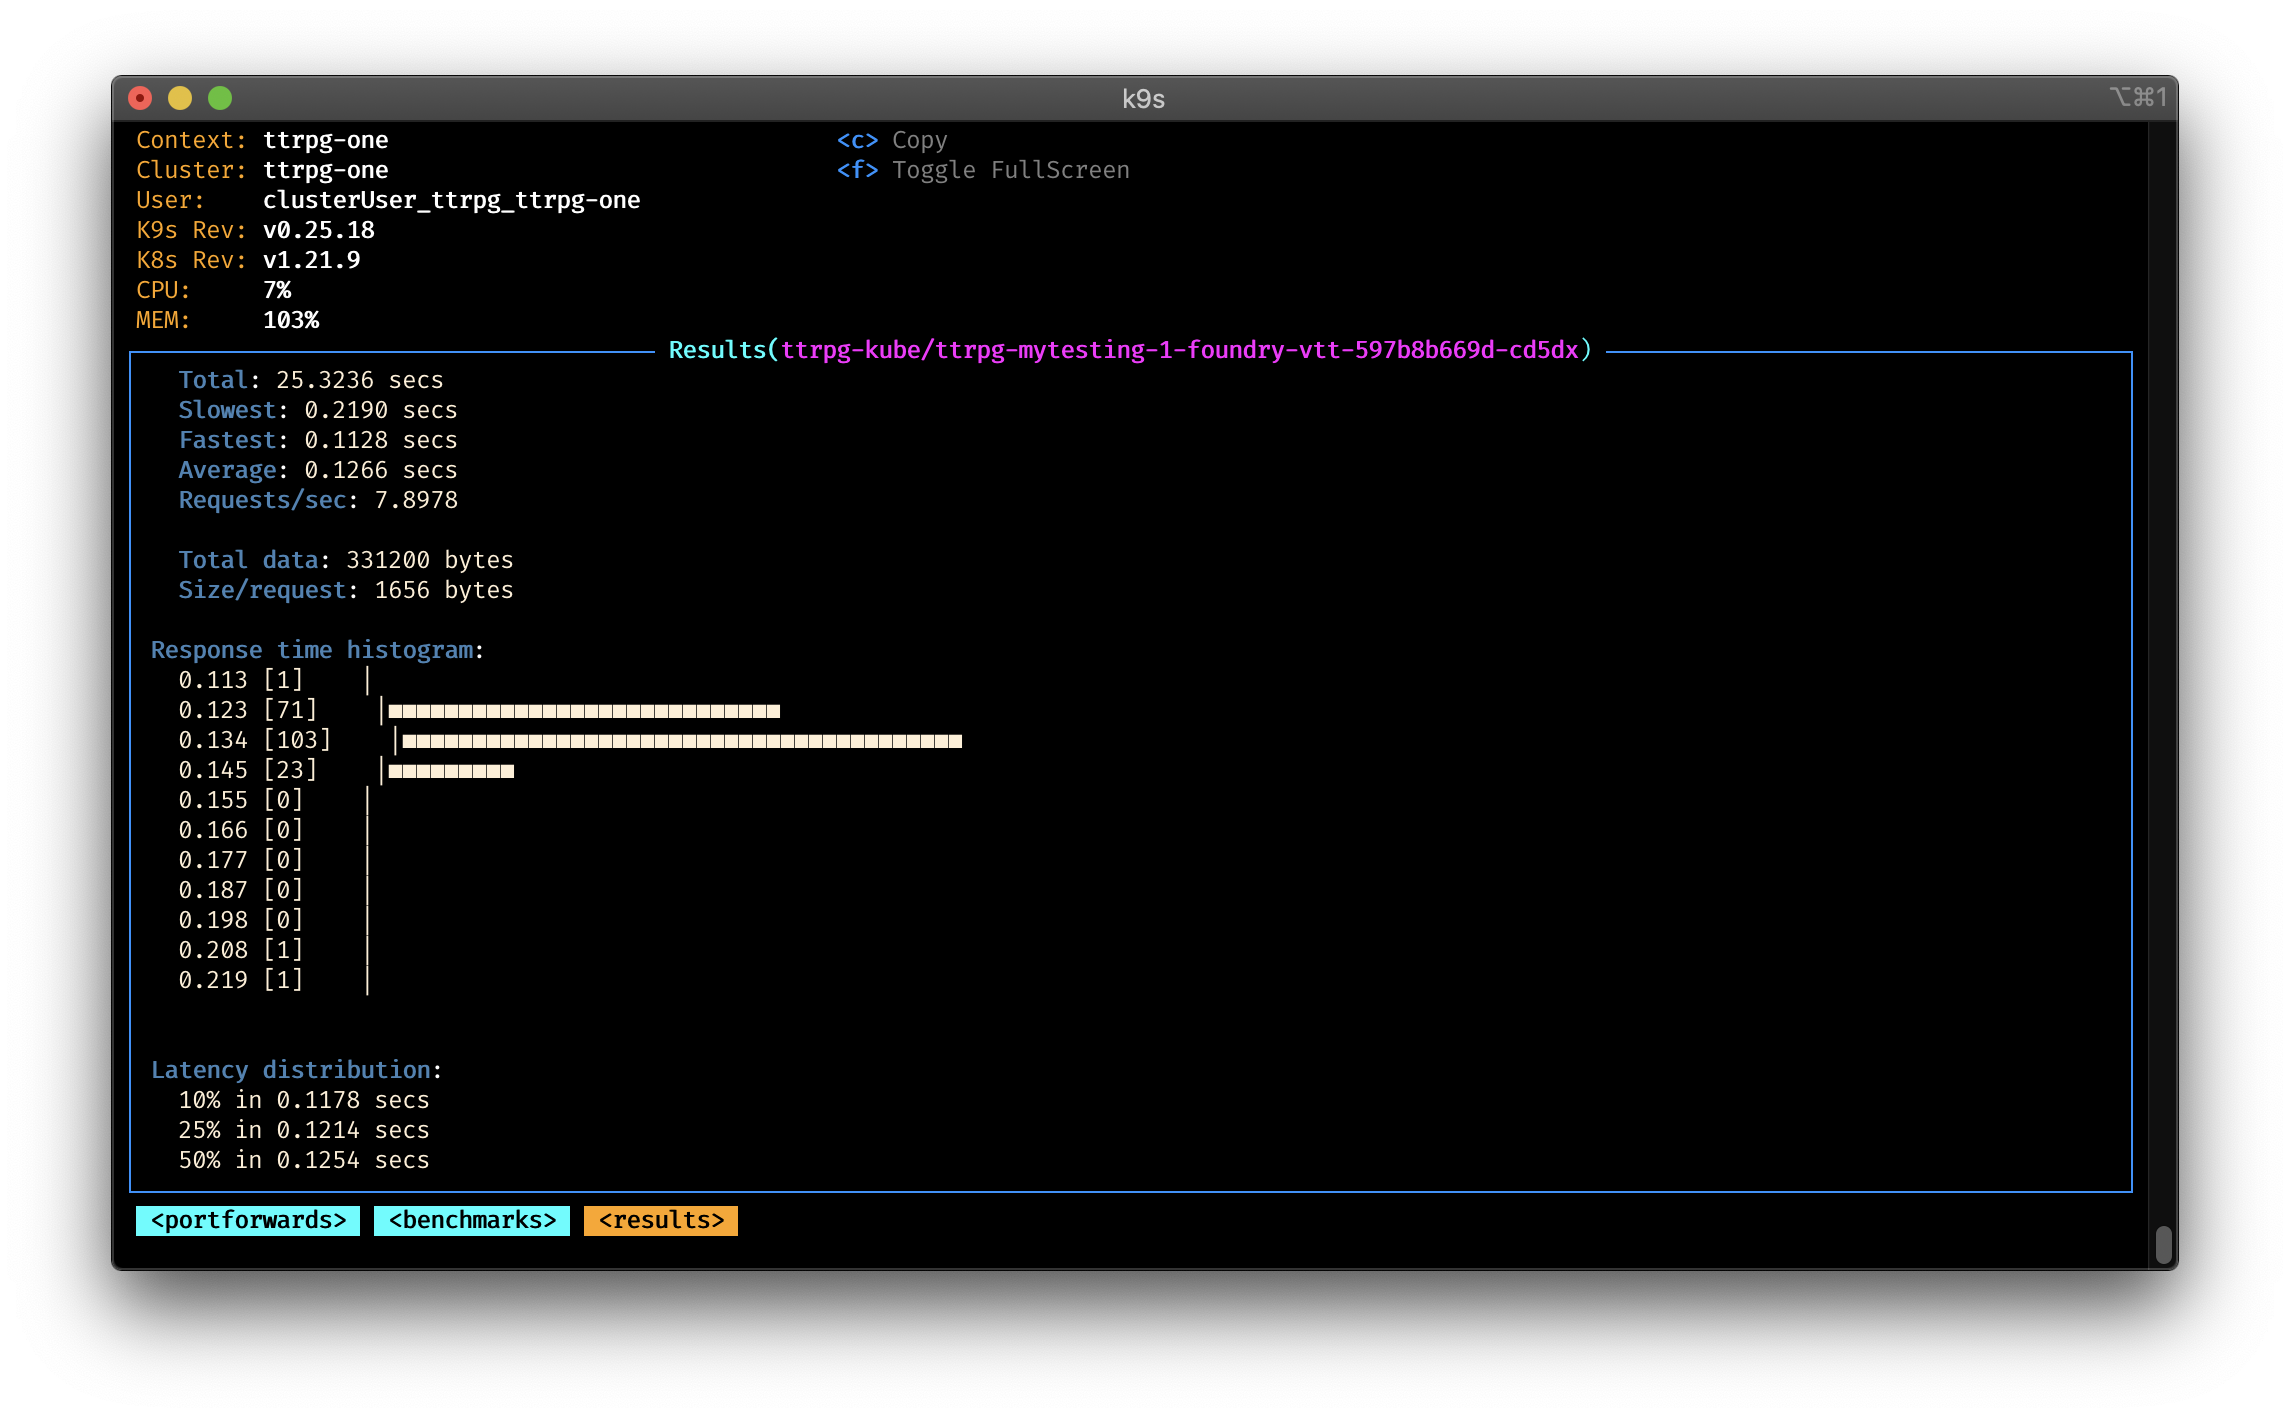
You can configure the benchmarking via the $XDG_CONFIG_HOME/k9s/bench-<my_context>.yml for your specific context.
More resources #
The K9s GitHub page -> https://github.com/derailed/k9s The official documentation page -> https://github.com/derailed/k9s

Cloud Native Pilgrim | Kubernetes Enthusiast | Serverless Believer | Customer Experience Architect @ Pulumi | (he/him) | CK{A,AD} |
Get new posts in your inbox.
Spotted a typo or want to improve this post? Edit on GitHub →