Four Pillars Of Observability in Kubernetes
Kubernetes is a complex system due to its distributed and dynamic nature, managing a large number of containers and services across multiple nodes, which…

On this page (8)
Kubernetes is a complex system due to its distributed and dynamic nature, managing a large number of containers and services across multiple nodes, which makes it difficult to manually monitor and manage. This is where Observability comes in by providing insight into the health, performance, and behavior of applications and clusters. Before we discuss the Four Pillars of Observability, let's understand what observability means.
Understanding Observability #
Observability refers to the ability to gain insight into the state and behavior of the application by collecting and analyzing various types of data. If this sounds overwhelming, let me readily explain you.
Suppose you own a big garage with a lot of cars. Now, you need to observe which car needs repairing or which car has a broken part. This is what observability does in the case of Kubernetes. Consider Kubernetes as a big garage with many nodes, clusters, services, CRD, etc which needs to be observed continuously for better the working of the application. By using special tools, we can check if things are running smoothly or if there are any problems that need fixing. This helps to make sure that everything is working the way it should be, just like how you want all of your cars to work properly.
Observability vs Monitoring #

Although observability and monitoring are often mentioned together, they serve different purposes.
Monitoring involves collecting and analyzing data and metrics from the Kubernetes cluster to ensure it's performing as expected. This can include things like checking CPU usage, memory usage, and network traffic of the cluster and its components, such as pods and nodes.
For observability, we can say that it is built on top of monitoring. Observability includes monitoring but goes beyond it to analyze logs, traces, and other techniques that can provide insights into the behavior of the application as a whole.
For example, in Kubernetes, monitoring might involve checking the CPU usage of a pod to ensure it's not running out of resources. Observability, on the other hand, might involve collecting and analyzing logs and metrics from multiple pods, services, and nodes in the cluster to gain insights into the overall health and performance of the entire system.
Four Pillars of Observability #
If you know about observability, you might've heard about the Three Pillars of Observability and might be wondering what's the fourth pillar. Well, here are the four pillars of observability:
-
Metrics
-
Tracing
-
Logging
-
Profiling

Metrics #
The definition refers to metrics as the data which is collected from different components of the cluster to monitor and measure the health and performance of the system. Metrics can provide insights into key aspects of the cluster such as CPU usage, memory usage, network traffic, and other performance-related data.
Suppose you want to know the performance of your car or you want to know how far it can travel, that's like a metric. In the same way, metrics will help you to analyze the performance of your cluster or your application.
Tools such as Prometheus, Dynatrace, and Datadag help you to fetch metrics.
Grafana provides a better view of these metrics using dashboards.

Tracing #
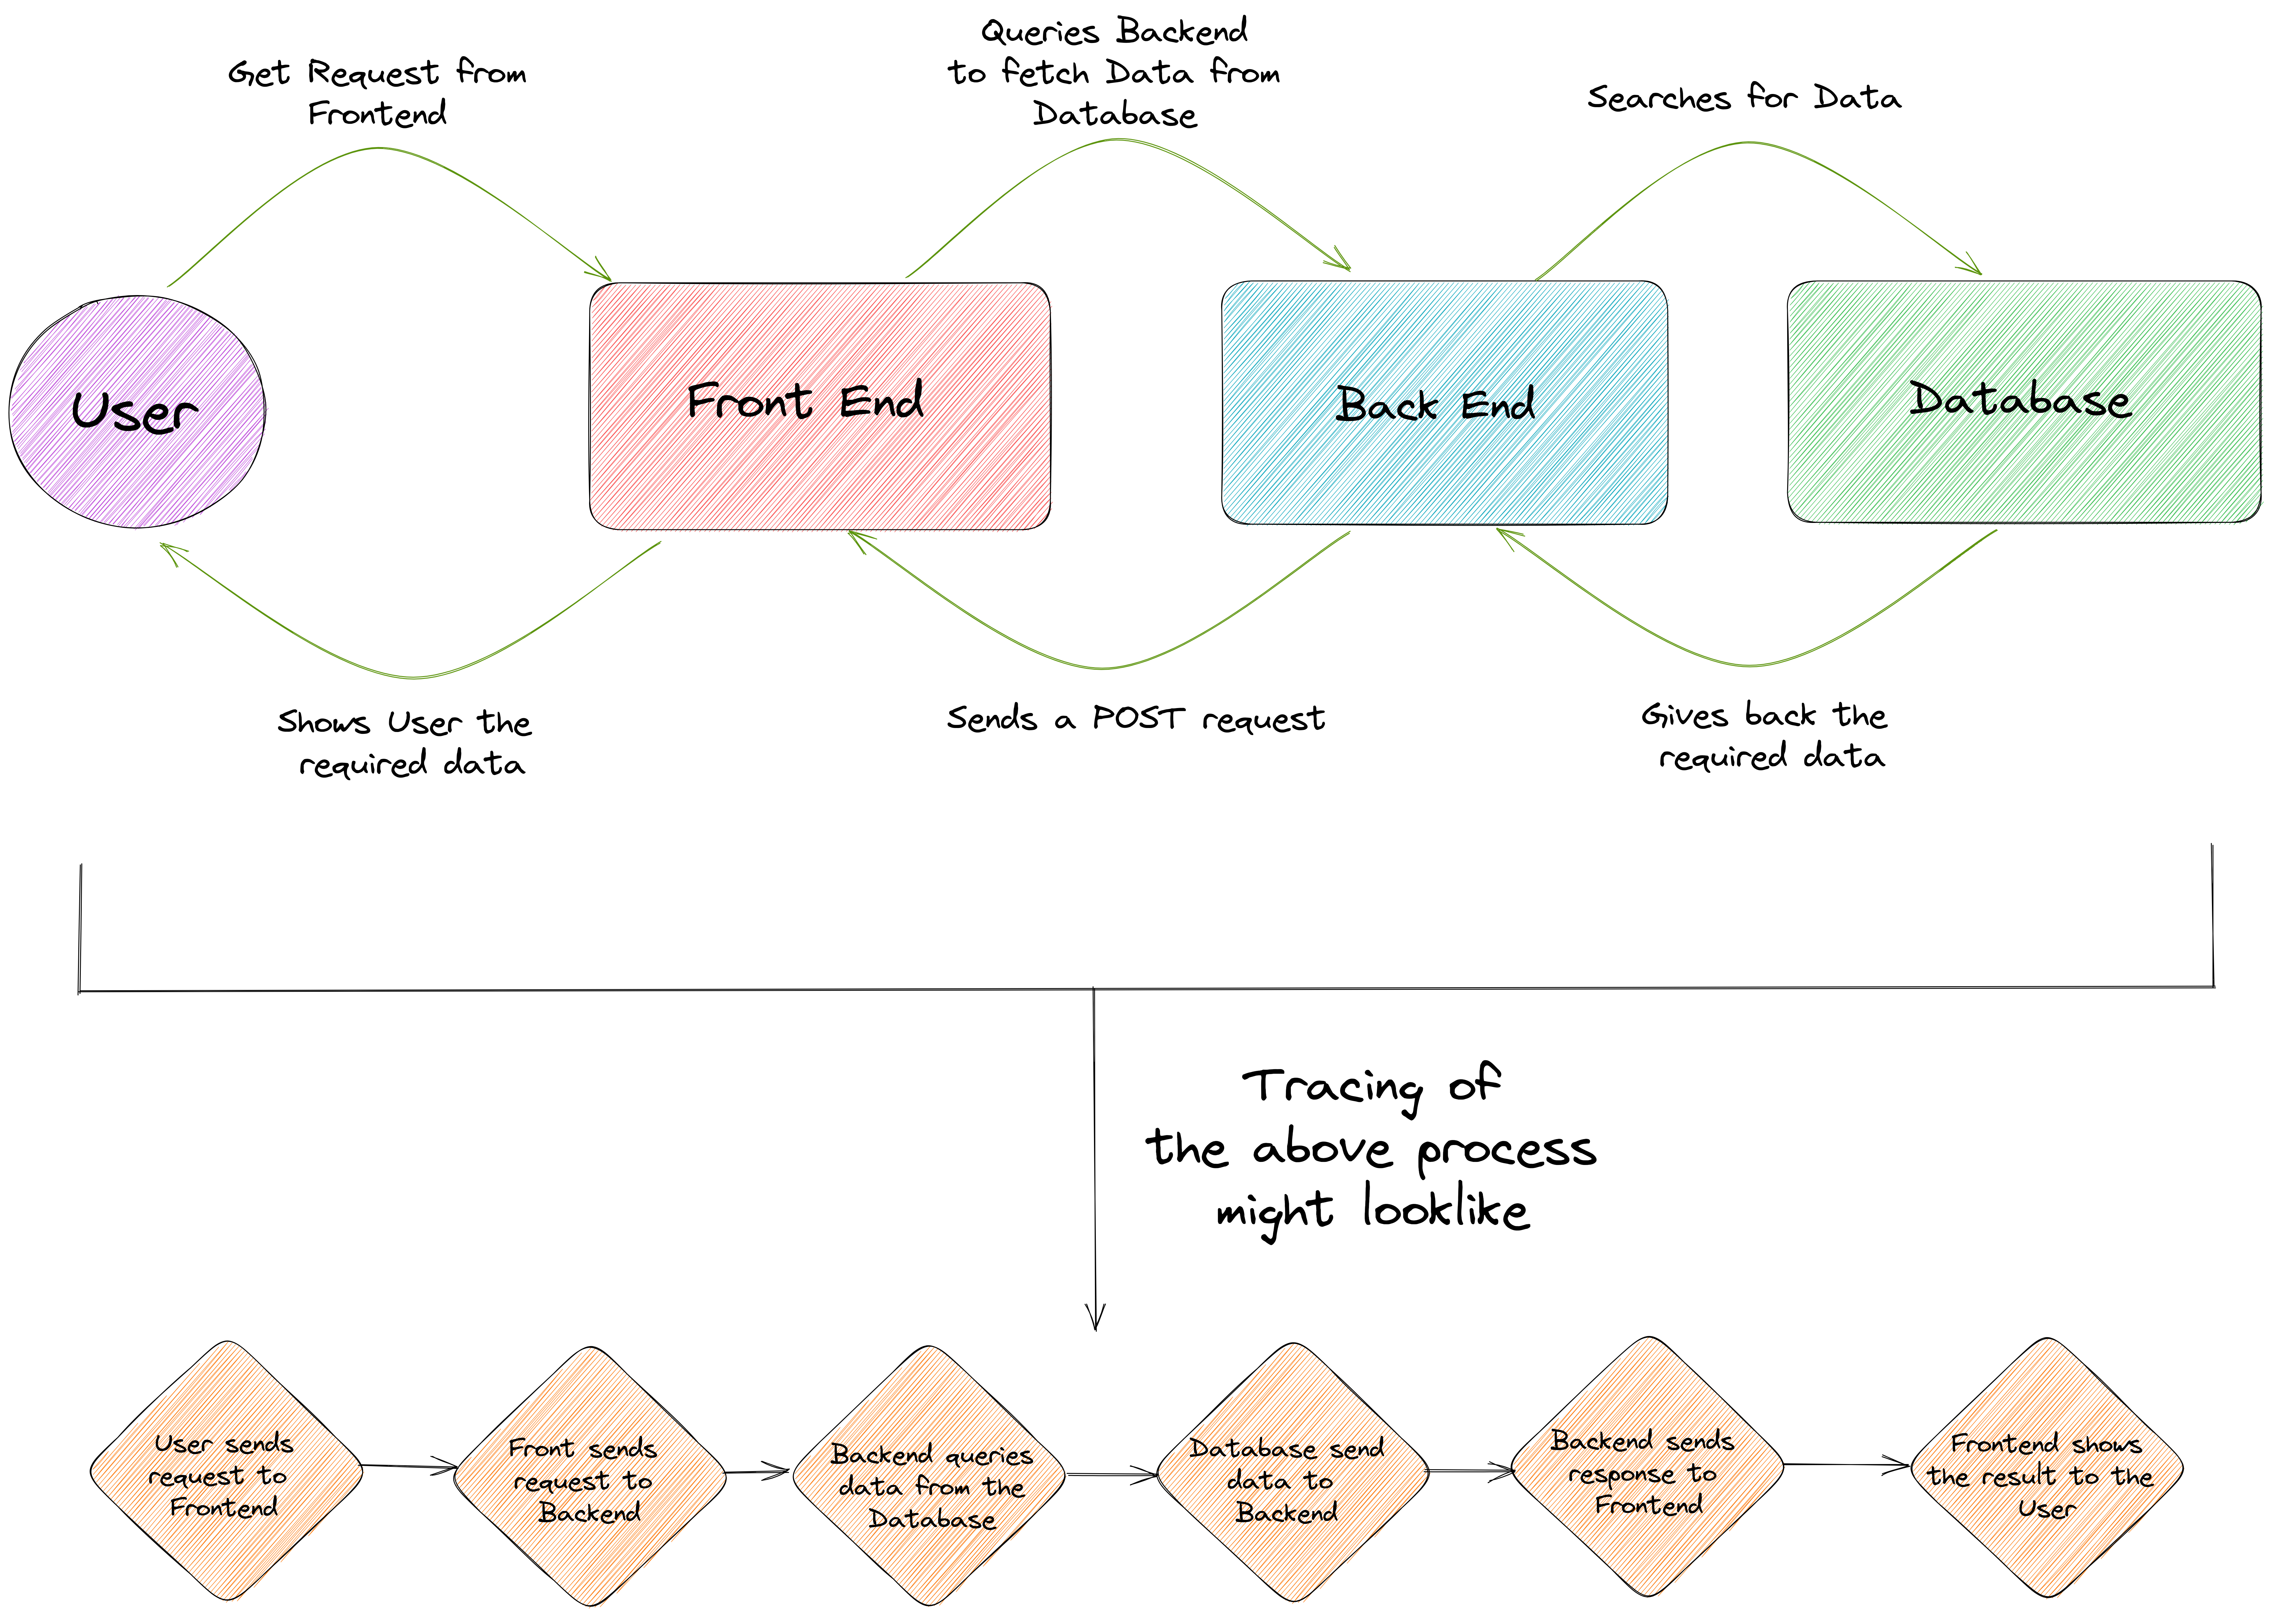
The definition refers to tracing as the practice of collecting and analyzing data about the requests that flow through your system, in order to identify and diagnose issues with application performance and behavior.
Suppose you are playing a game of tag and someone tags you. Now you need to figure out who tagged you by tracing back to where they came from. That's like tracing in Kubernetes, it helps you figure out what's happening by following the path of something.
Logging #
The definition refers to logging as the practice of collecting and storing data about the events and activities that occur within your cluster, in order to monitor and diagnose issues with your applications and infrastructure.
Imagine you have a diary where you write down everything you do each day. That's like logging, it helps you keep track of what you did and when you did it. In Kubernetes, we use logging to keep track of what's happening in the cluster or in our application. For example, if there's an error, we can look at the logs to figure out what went wrong.

Profiling #
Profiling has been the latest addition to the pillars of observability. It refers to the practice of analyzing the performance of your applications and cluster, in order to identify areas of inefficiency that may be impacting their performance. Profiling can help you understand how your applications are using resources like CPU and memory, and identify areas where optimization may be needed to improve their performance.
Imagine you have a friend who's really good at drawing, and you want to learn how they do it. You might watch them draw and try to copy their technique. That's like profiling, it helps us understand how something is done by watching it in action. Just like in Kubernetes, we use profiling to figure out how our cluster or our application is working and where we can make it work better.

The above image represents a Flame Graph. A FlameGraph is a way to visualize the profile of an application allowing it to instantly detect the most frequent code path. They can be particularly useful in a Kubernetes environment, where multiple containers are running on a cluster, and you need to identify performance bottlenecks.
Wrapping up #
In this blog post, I briefed you about observability, monitoring vs observability, and the four pillars of observability.
In the next blog posts, we will try to dive deep into the four pillars of observability separately with a demo.
You can reach out to me on Twitter or LinkedIn if you would like to have a chat about Cloud Native, Observability, or DevOps.
Thank you for reading :)
Follow Kubesimplify on Hashnode, Twitter and Linkedin. Join our Discord server to learn with us.
Get new posts in your inbox.
Spotted a typo or want to improve this post? Edit on GitHub →