Optimizing Scalability: A Deep Dive into Load Testing with Locust on EKS
This article explores strategies for optimizing scalability using Locust for load testing on Amazon EKS.

On this page (15)
- Introduction
- Prerequisites
- Understanding Horizontal Pod Autoscaler
- Introduction to Locust
- Create VPC and EKS using the Terraform module
- Install monitoring components on the cluster
- Deploy sample app
- Deploy Locust
- Demo
- Observation: Cluster Scaling
- HPA
- Pending State
- Automatic Node Creation by Cluster Autoscaler
- Transition to Running State for Pods
- Conclusion
Introduction #
This article explores strategies for optimizing scalability using Locust for load testing on Amazon EKS. We'll delve into scaling a Node.js app using Kubernetes' HPA and Cluster Autoscaler based on the load generated by Locust workers. The aim is to provide practical insights into ensuring applications can efficiently handle increasing user loads.
Prerequisites #
-
Ensure you have AWS CLI configured with appropriate permissions and Terraform installed locally.
-
A basic understanding of AWS services, Terraform, Kubernetes concepts, Horizontal Pod Autoscaling (HPA) principles, and familiarity with the Kubernetes Cluster Autoscaler is required.
Understanding Horizontal Pod Autoscaler #
Horizontal Pod Autoscaler(HPA) automatically adjusts the number of replica pods in a deployment or replication controller based on observed CPU utilization or other custom metrics. This ensures the application has sufficient resources to handle varying loads, thus improving performance and scalability.
Introduction to Locust #
Locust is an open-source load-testing tool that allows you to define user behavior with Python code. It simulates thousands of concurrent users hitting your application, making it an excellent choice for load testing in Kubernetes environments.
Now that we've covered the prerequisites, let's proceed with setting up two EKS clusters: one for our App and another for Locust. We'll use Terraform's official modules, configure worker node autoscaling policies, enable Horizontal Pod Autoscaling (HPA) through the Metric Server, and integrate the Cluster Autoscaler for dynamic scaling of cluster nodes based on resource utilization.
Create VPC and EKS using the Terraform module #
-
Apply the terraform command.
-
Add a policy to the worker node role.
{ "Version": "2012-10-17", "Statement": [ { "Effect": "Allow", "Action": [ "autoscaling:DescribeAutoScalingGroups", "autoscaling:DescribeAutoScalingInstances", "autoscaling:DescribeLaunchConfigurations", "autoscaling:DescribeScalingActivities", "autoscaling:DescribeTags", "ec2:DescribeImages", "ec2:DescribeInstanceTypes", "ec2:DescribeLaunchTemplateVersions", "ec2:GetInstanceTypesFromInstanceRequirements", "eks:DescribeNodegroup" ], "Resource": ["*"] }, { "Effect": "Allow", "Action": [ "autoscaling:SetDesiredCapacity", "autoscaling:TerminateInstanceInAutoScalingGroup" ], "Resource": ["*"] } ] } -
Apply cluster autoscaler yaml after updating the
cluster-nameandimage versionin the deployment section to match your Kubernetes version. -
Add the metric server for HPA to gather data.
kubectl apply -f https://github.com/kubernetes-sigs/metrics-server/releases/latest/download/components.yaml -
We need to create HPA for both locust and app after deploying them.
kubectl autoscale deployment <deploy-name> --cpu-percent=50 --min=1 --max=10
Install monitoring components on the cluster #
Run the following commands:
helm repo add prometheus-community https://prometheus-community.github.io/helm-charts
helm repo update
kubectl create ns monitoring
helm install monitoring prometheus-community/kube-prometheus-stack -n monitoring-
Edit the service of Prometheus and Grafana from ClusterIP to
LoadBalancerto access the UI. -
Prometheus doesn't require an initial password, for Grafana we can run
kubectl get secret --namespace monitoring monitoring-grafana -o jsonpath="{.data.admin-password}" | base64 --decode ; echo
Deploy sample app #
-
After applying the manifests, access the app using the LoadBalancer IP.
-
Configuration File for Application Monitoring
apiVersion: monitoring.coreos.com/v1 kind: ServiceMonitor metadata: name: monitoring-node-app labels: release: monitoring app: nodeapp spec: endpoints: - path: /metrics port: service targetPort: 3000 namespaceSelector: matchNames: - nodeapp # namespace in which app is deployed selector: matchLabels: app: nodeapp -
After applying the above YAML, add metrics in Grafana to view the dashboard.
-
In Prometheus UI search for
http_request_operations_total(for total request generated) andsum(rate(http_request_operations_total[15m]))(for request/second). -
In Grafana UI create a new dashboard by adding the above two metrics.
Deploy Locust #
-
Update the Configmap provided in the GitHub repo before applying it. Add the actual URL of the app in the
tasksection so that Locust can send traffic to the right place. Locust's master service is configured as LoadBalancer type to access the UI. -
Locust's master service is configured as
LoadBalancertype to access the UI.
Demo #
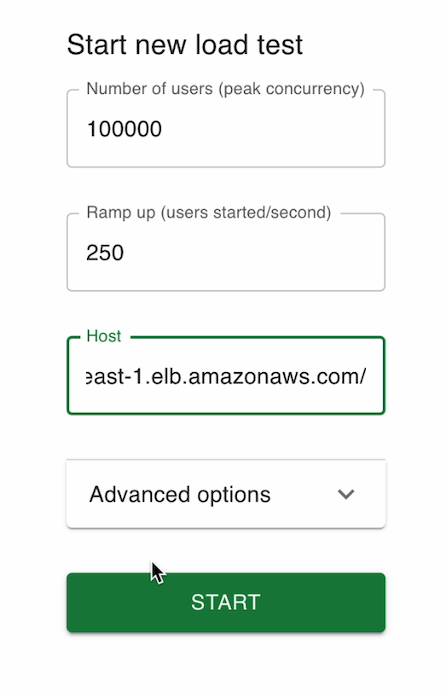
Access the UI of locust and Run the Test
Access the Locust UI to configure and initiate the load test. Define the behavior of simulated users, such as the number of users, the rate of requests, and specific endpoints to target.
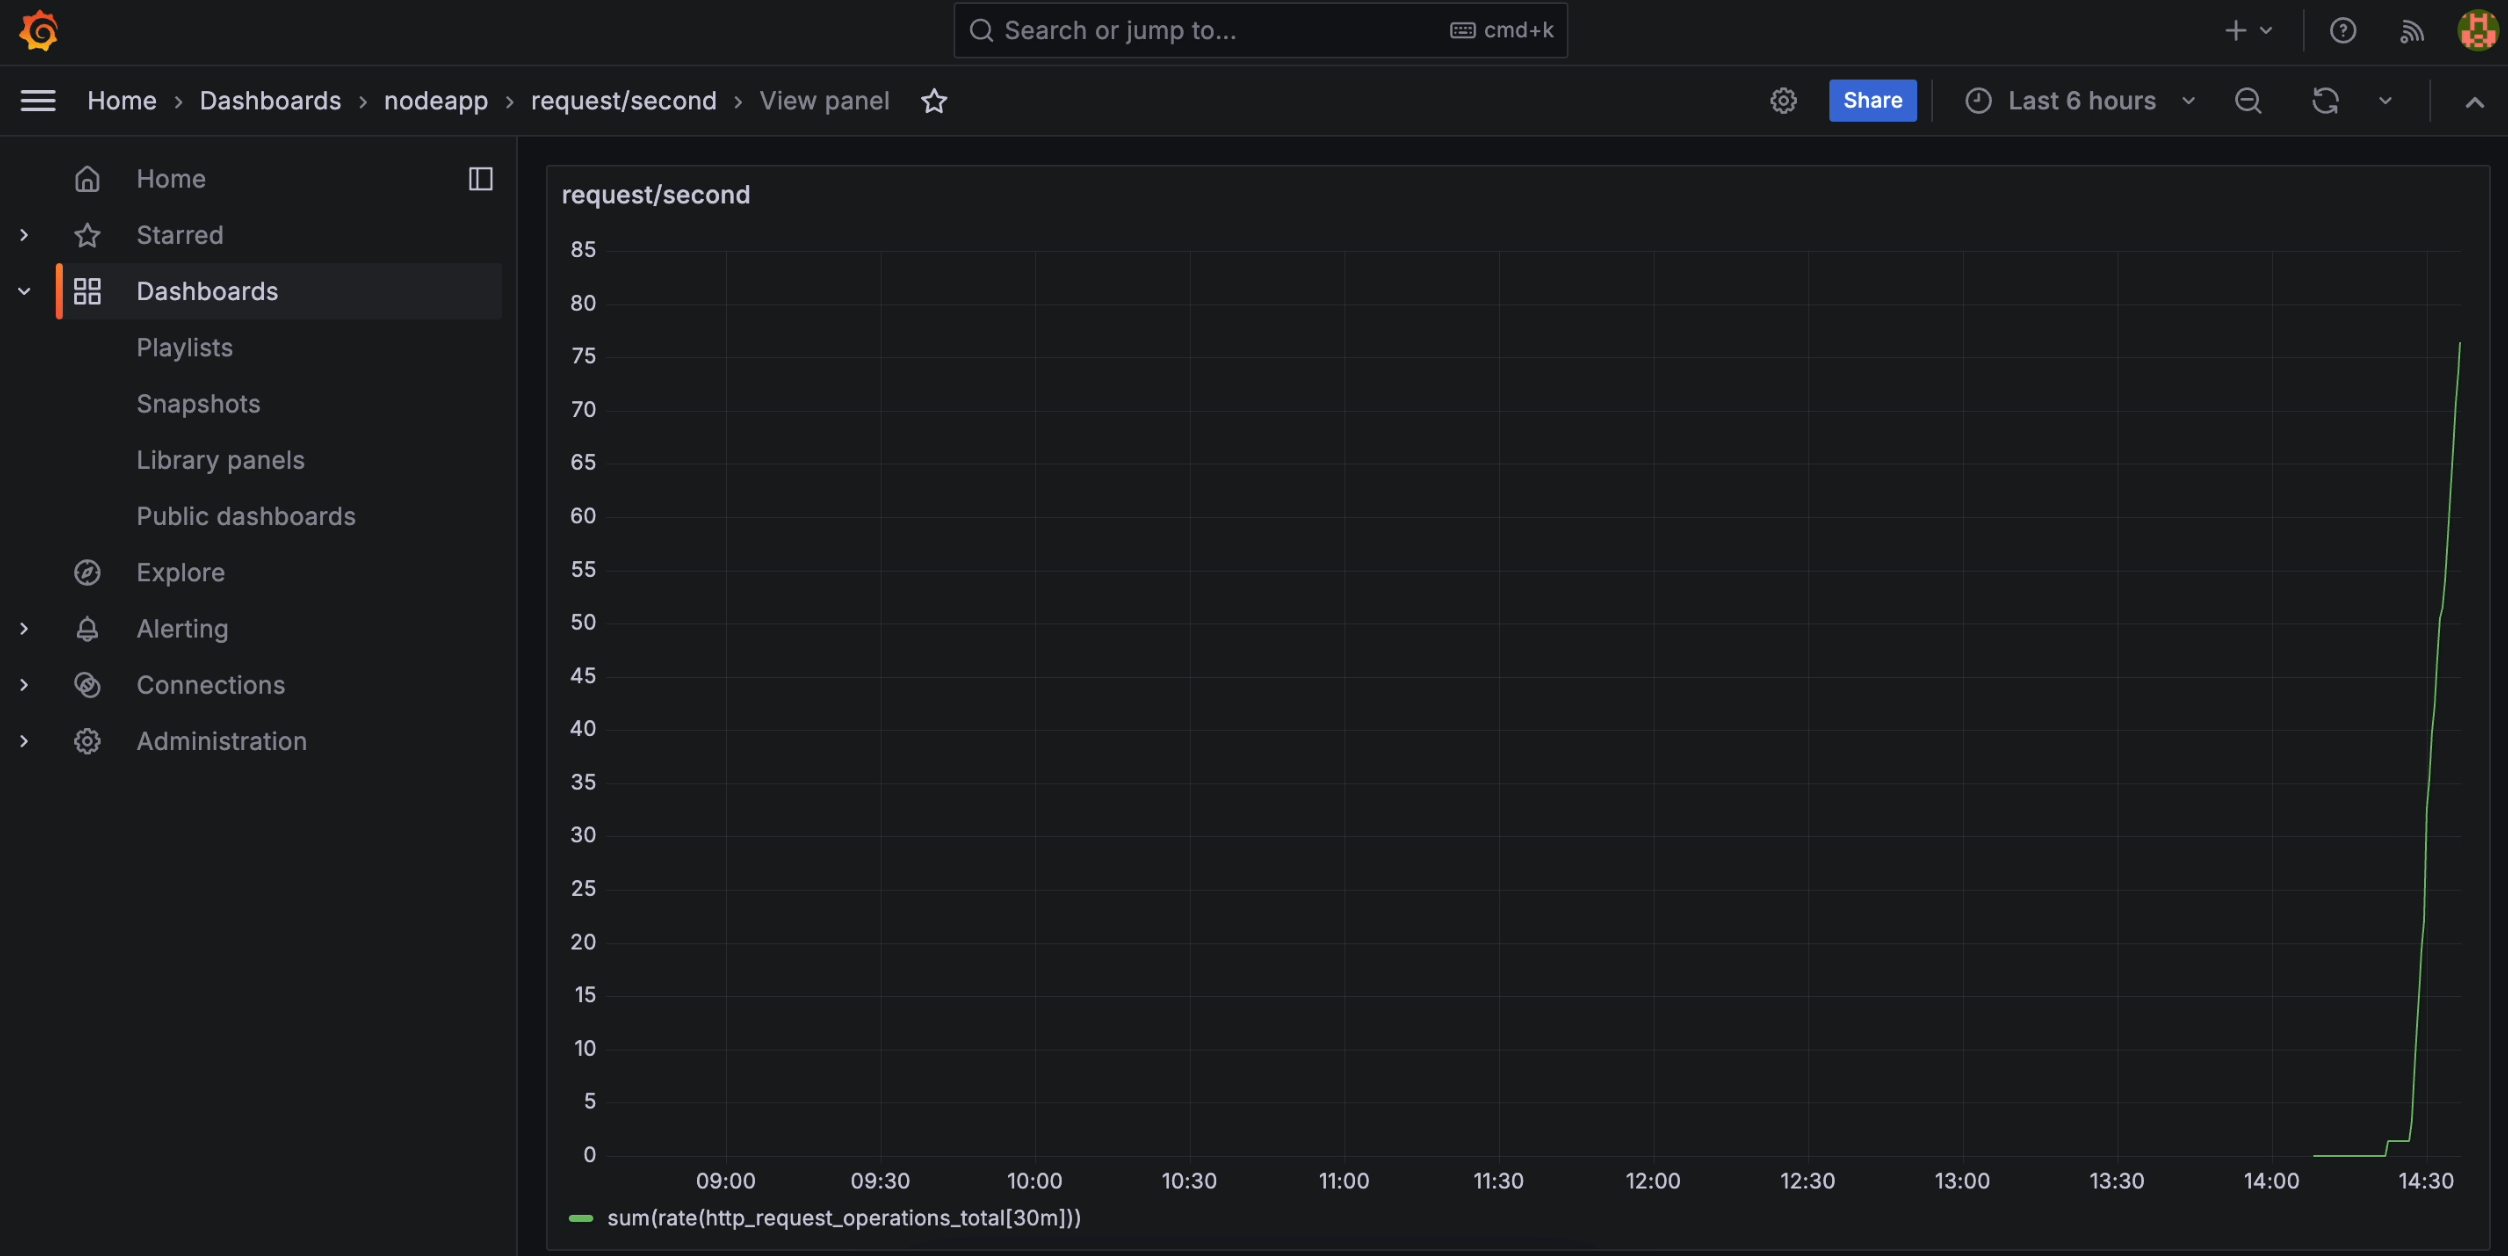
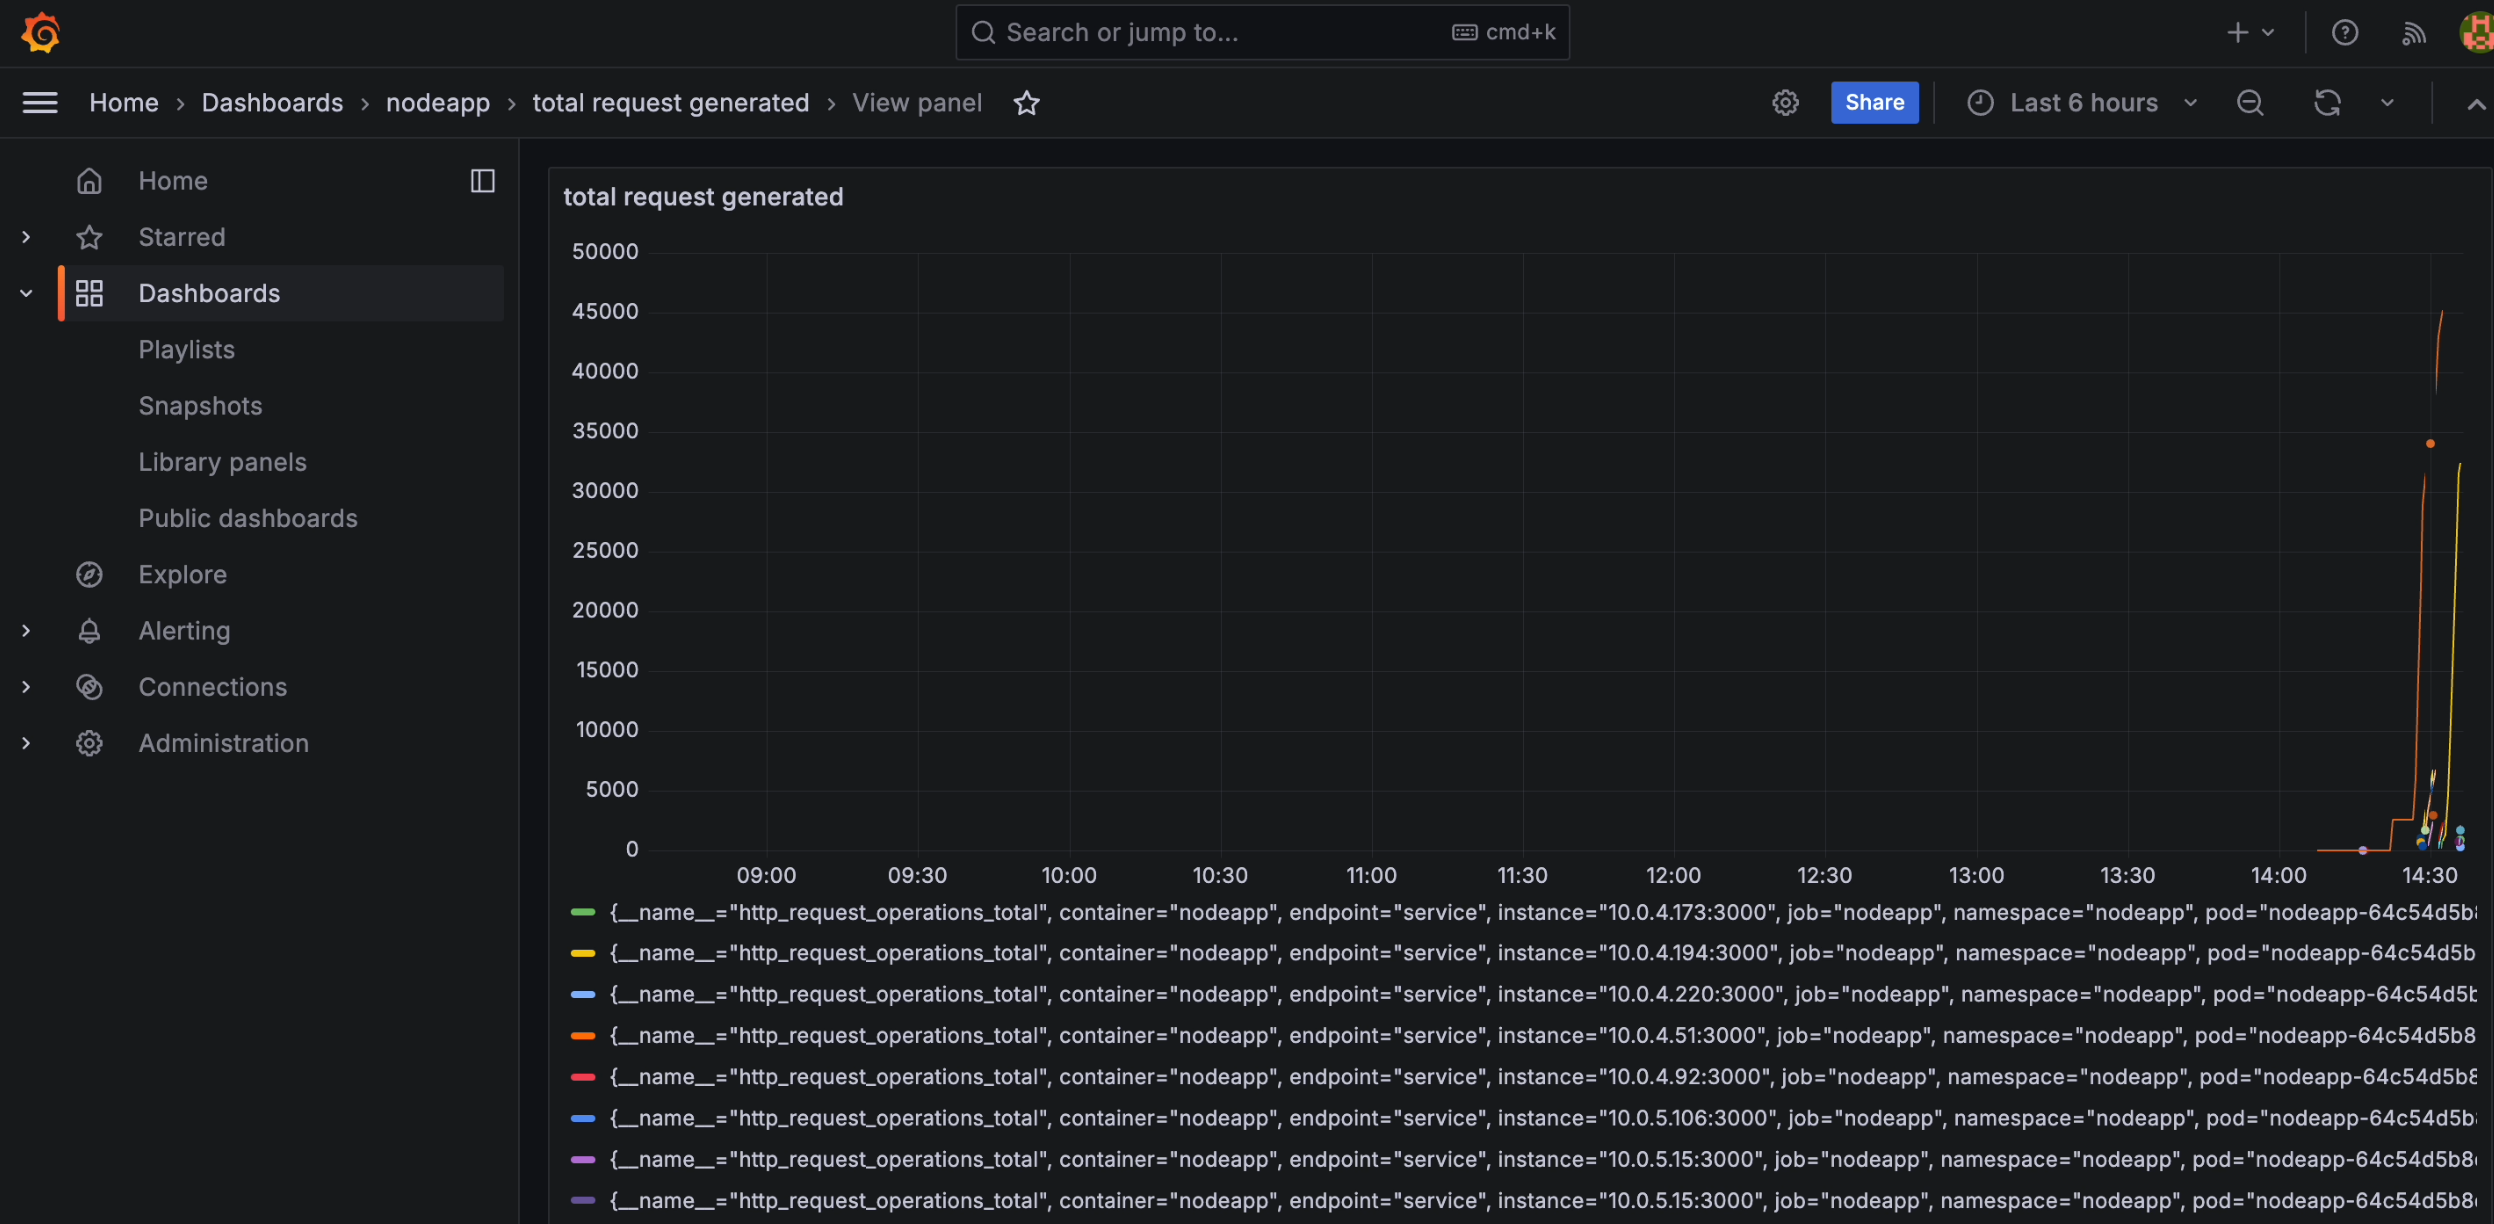
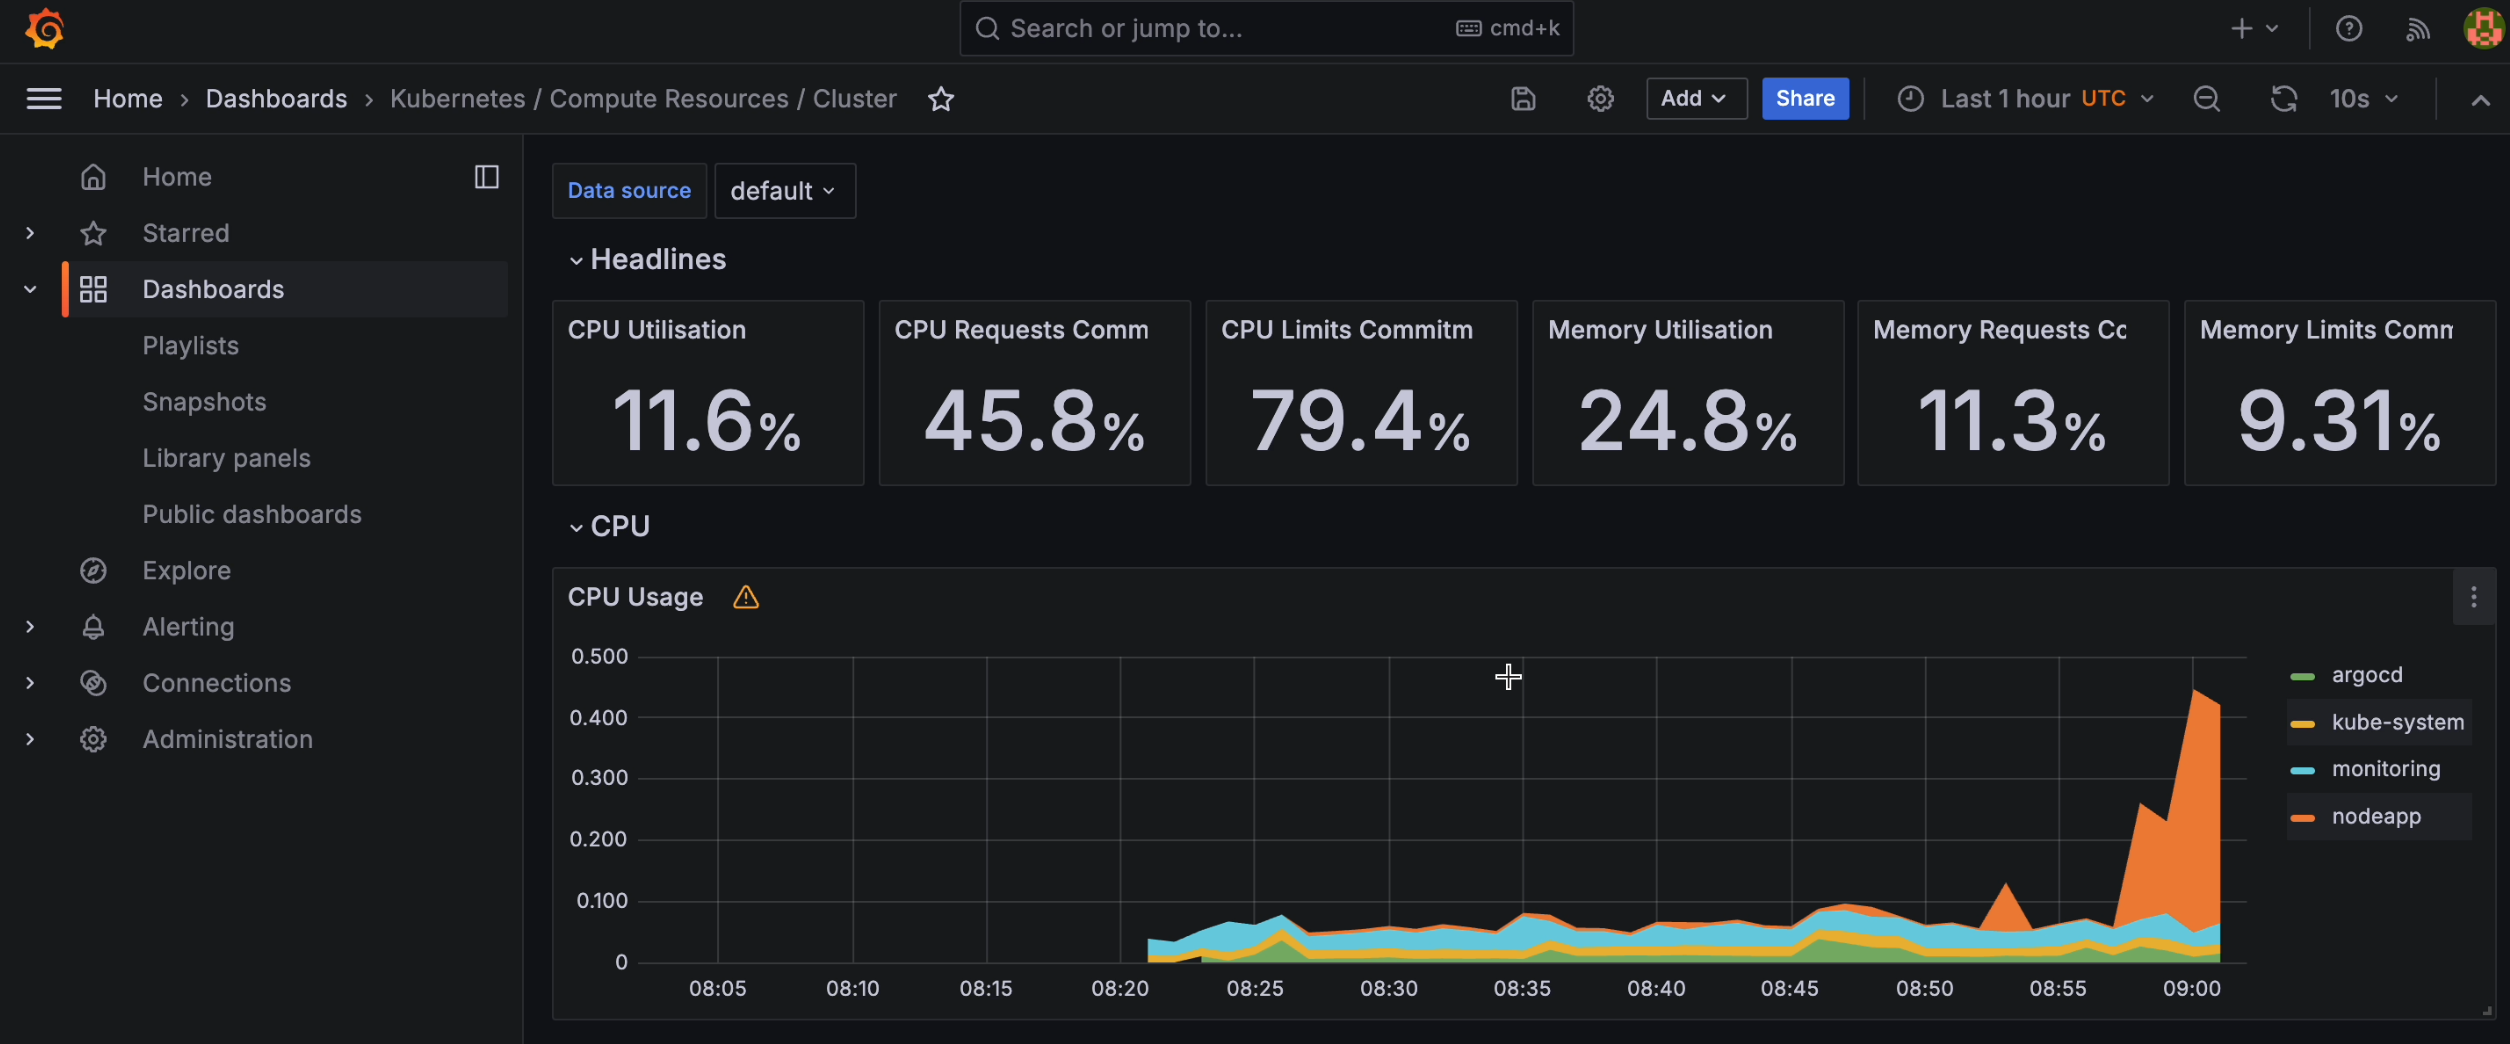
Grafana Dashboard
- This metric indicates the rate at which Locust generates requests to your Node.js app, showcasing the simulated load.
- This metric presents the total number of requests sent by Locust to your application, offering a comprehensive view of the applied load.
- Observe the cluster's resource utilization metrics, including CPU and memory usage, and witness the dynamic scaling of the cluster in response to increased load.
- Allow it to run for a few minutes, during which time you can switch between the "Statistics" tab and the "Charts" tab to observe the progress of the test.
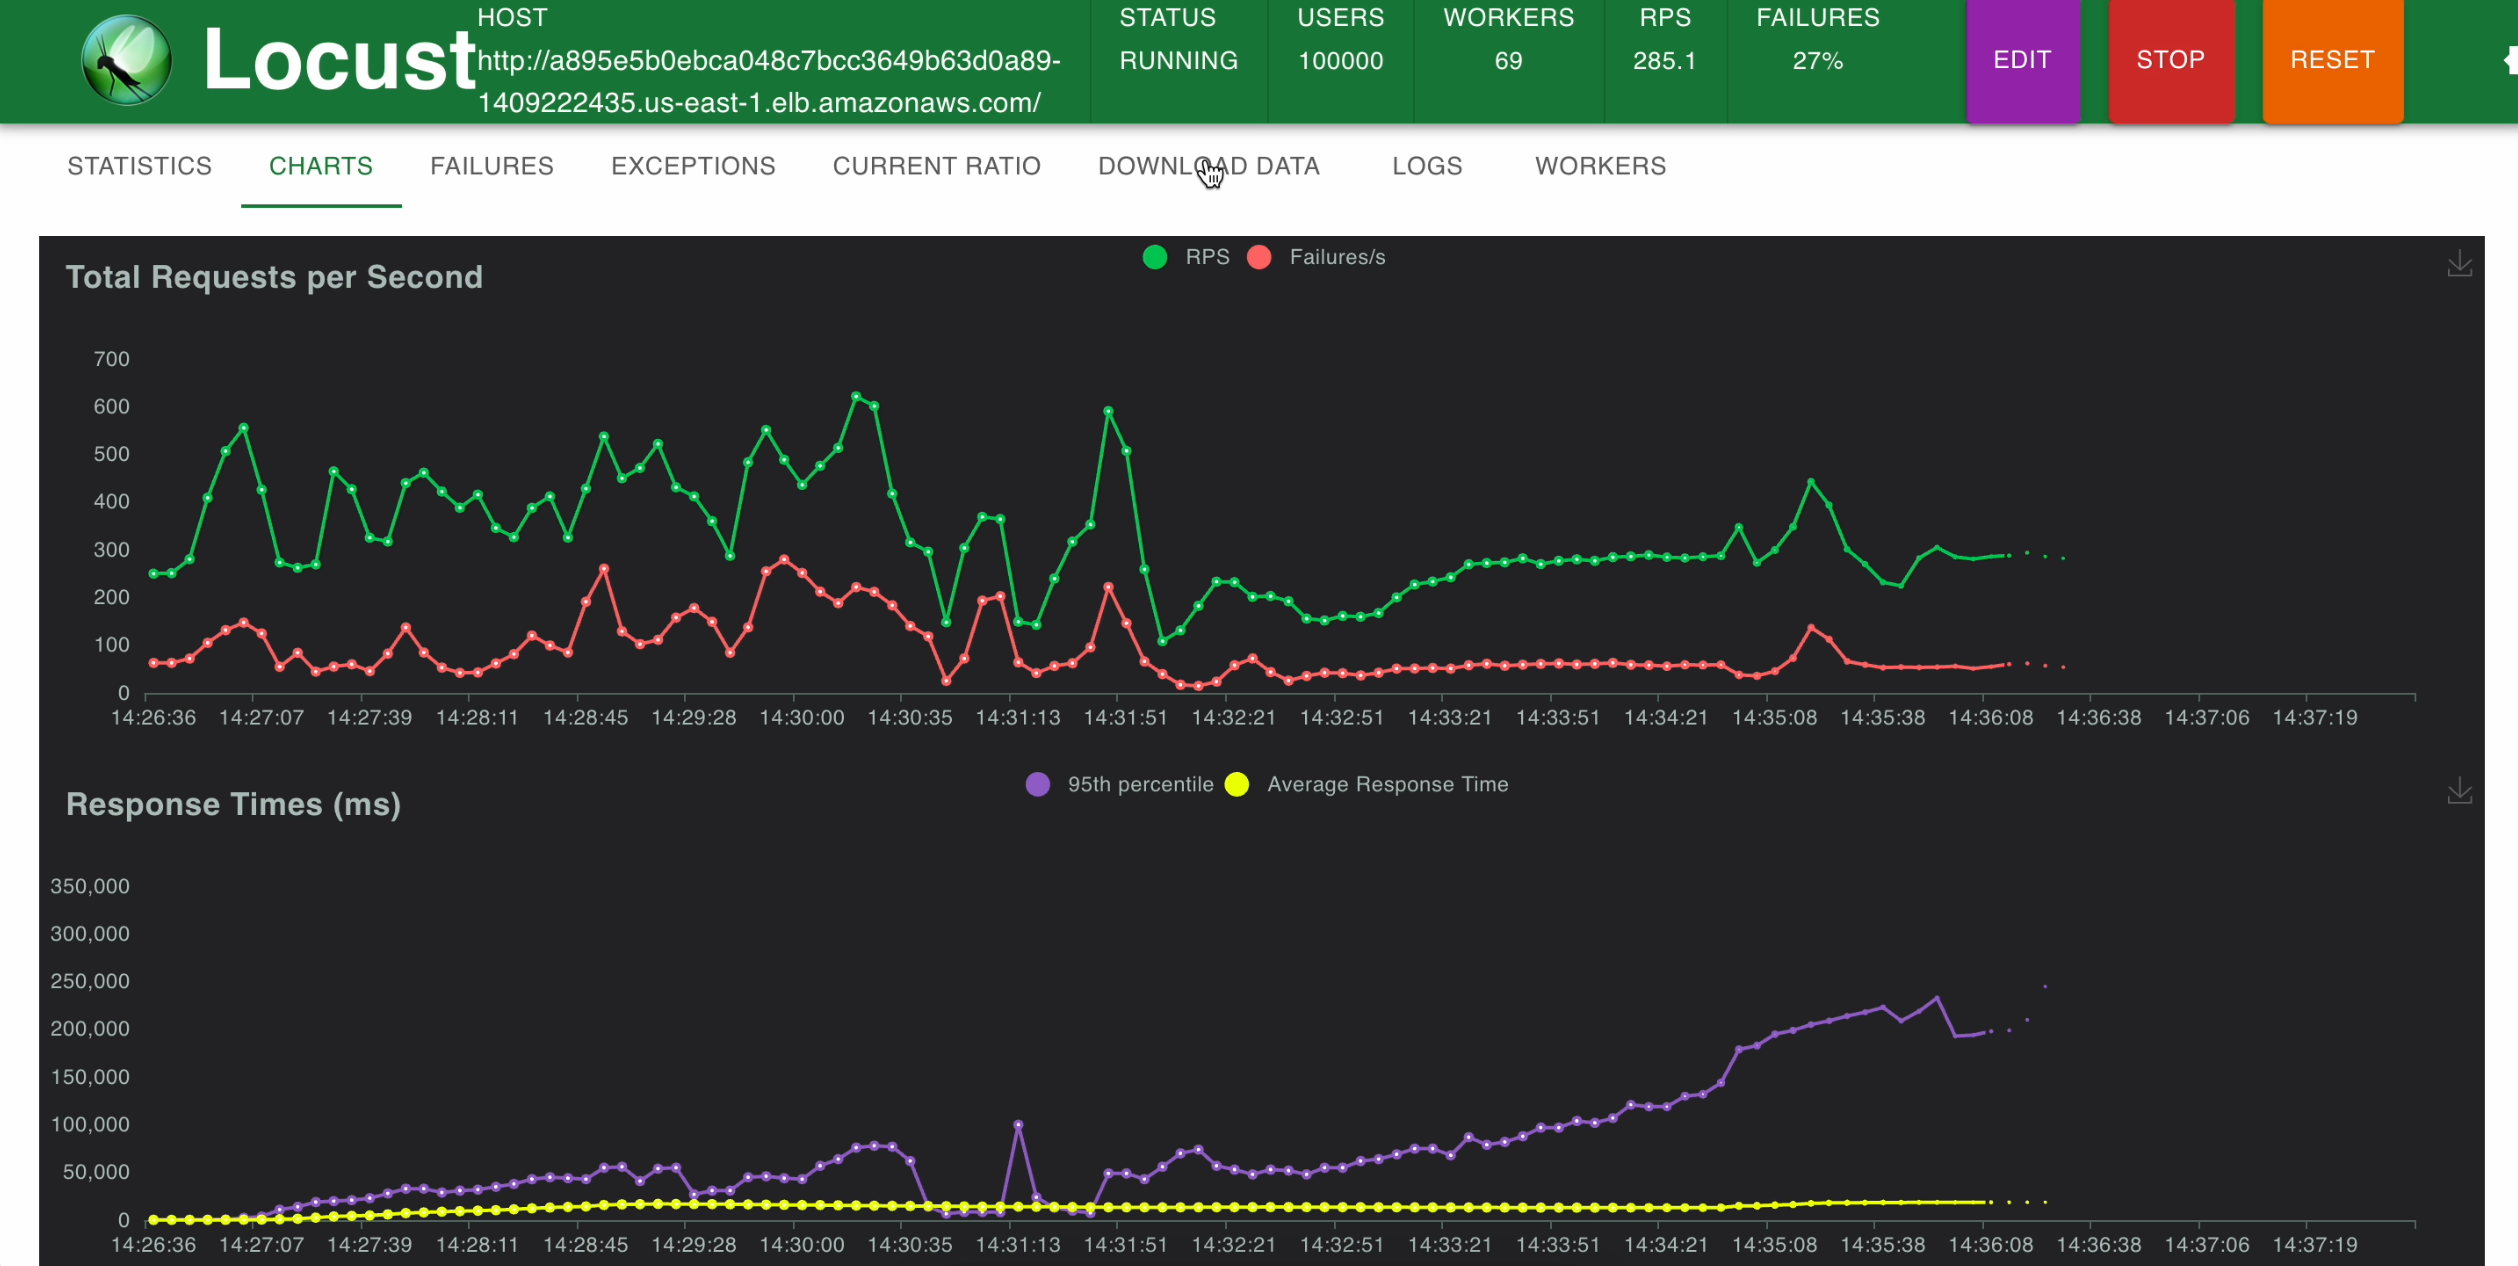
We can observe that 69 Locust workers have been created using HPA, to generate load on our app.
Observation: Cluster Scaling #
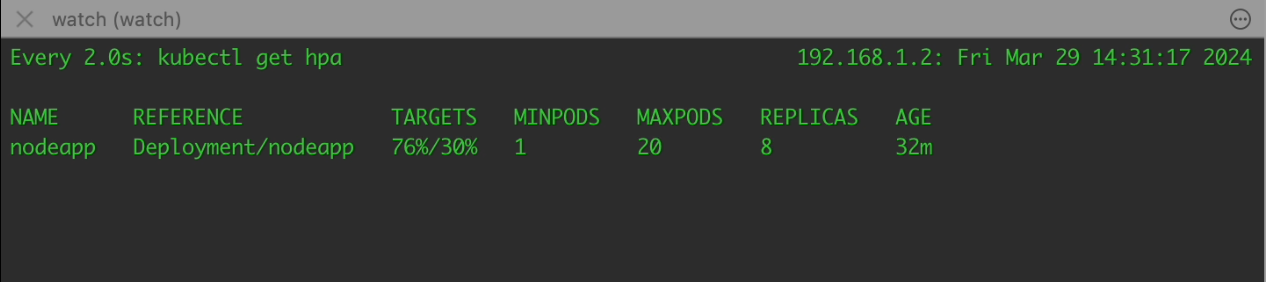
HPA #
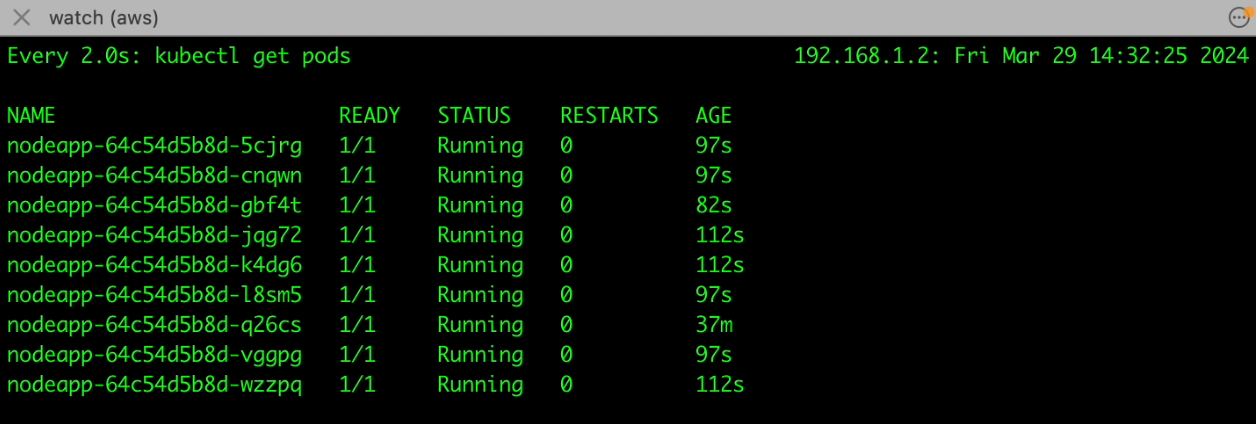
When the workload on your Node.js application surpasses the defined threshold, which is determined by CPU utilization, the Horizontal Pod Autoscaler (HPA) takes action. It dynamically adjusts the number of pods running your application to match the current demand. This means that if your application experiences higher traffic or processes more requests, HPA will trigger the creation of a new pod to handle the additional load.
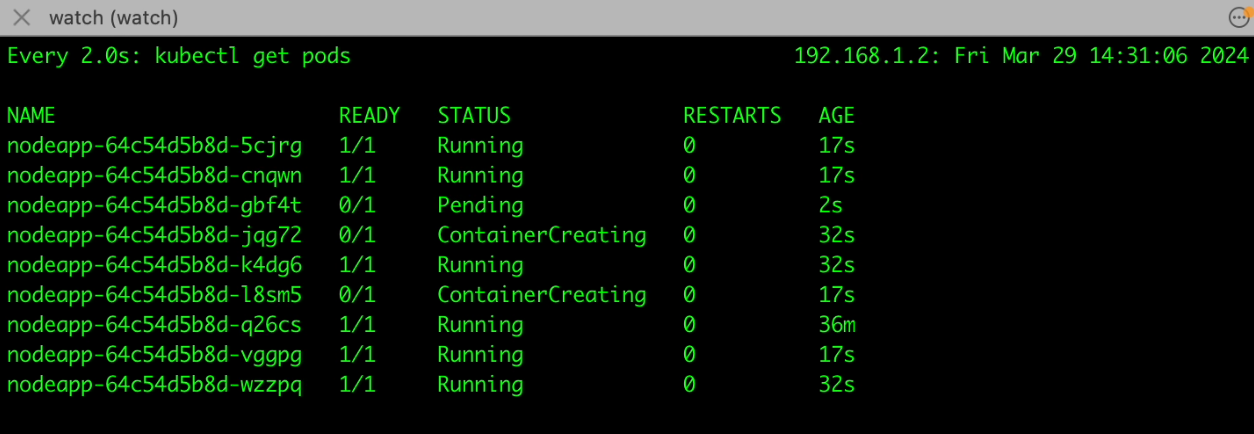
Pending State #
After HPA initiates the creation of a new pod, the Kubernetes scheduler tries to assign the pod to an available node within your cluster. However, if there aren't enough resources (such as CPU, memory, or disk space) on the existing nodes to accommodate the new pod, it enters a "pending" state. This indicates that the pod is waiting for resources to become available before it can start running.
Automatic Node Creation by Cluster Autoscaler #
Recognizing that the pending pod requires additional resources that cannot be met by the existing nodes, the Cluster Autoscaler takes action. It monitors the resource utilization across your cluster and identifies the need for more computing capacity. In response to this demand, the Cluster Autoscaler automatically provisions a new worker node (virtual machine) within your Kubernetes cluster.
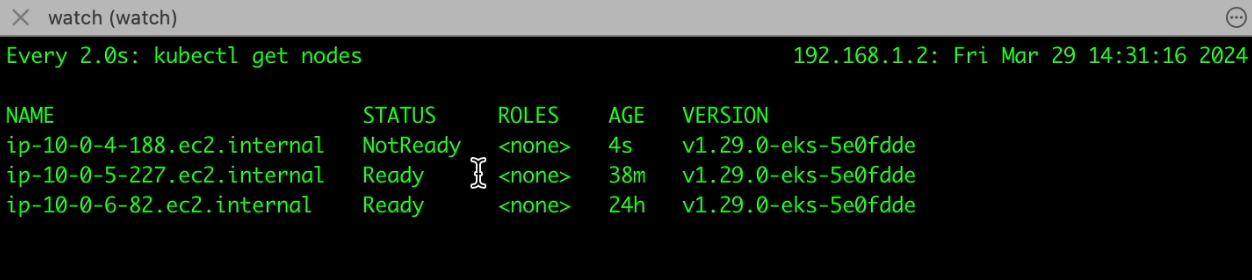
Transition to Running State for Pods #
Once the new worker node is provisioned and ready to accept pods, the pending pod transitions from the "pending" state to the "running" state, this signifies that the pod is now actively serving requests and contributing to handling the increased load on your application. With the new pod running and workload distributed across multiple pods, your application can effectively manage the surge in traffic without compromising performance or availability.
Conclusion #
In summary, this detailed exploration of load testing with Locust on Amazon EKS focused on optimizing scalability for a Node.js application using Kubernetes' HPA and Cluster Autoscaler. Key steps included setting up EKS clusters, implementing worker node autoscaling policies, enabling HPA, integrating the Cluster Autoscaler, and deploying monitoring components like Prometheus and Grafana. The process showcased how the system dynamically scaled resources in response to increased load, ensuring efficient traffic handling. Overall, this guide offers practical insights for developers and DevOps teams to improve scalability and performance in Kubernetes environments.
Remember to delete all resources after the demo.
Get new posts in your inbox.
Spotted a typo or want to improve this post? Edit on GitHub →