Day 5: Local LLM Inference Engines, Wrappers, and What to Pick
A beginner-friendly guide to local LLM inference, with the same Qwen model tested through Ollama, llama.cpp, Docker Model Runner, vLLM, SGLang, and TensorRT-LLM on NVIDIA DGX Spark.
New to the jargon? Every term, flag, and benchmark number here is explained in plain English in the local LLM glossary.
On this page (44)
- First, what is inference?
- Then, what is an inference engine?
- What happens when a request arrives
- Four clocks, not one speed number
- The cast
- Ollama: the easiest first step
- Ollama on Spark today: what I measured
- When Ollama is the right choice
- llama.cpp: the engine under the friendly wrappers
- Bare llama.cpp on Spark: what I measured
- Speculative decoding and MTP, in plain English
- Docker Model Runner: Docker-native local models
- LM Studio and llmster: GUI when you want it, headless when you do not
- vLLM: the general production-serving workhorse
- PagedAttention, in plain English
- Chunked prefill, in plain English
- The vLLM image problem on Spark
- SGLang: when many requests share the same prefix
- TensorRT-LLM: NVIDIA's performance path
- TensorRT-LLM on Spark: what I measured
- NVIDIA NIM: packaged and supported serving
- Hermes Agent, NemoClaw, OpenClaw: not engines, but still important
- The fairest comparison I could make on one Spark
- Lane A: the exact same GGUF file
- Lane B: the exact same BF16 checkpoint
- The test protocol
- The honest comparison table
- My practical decision tree
- The six things that go wrong
- 1. CUDA out of memory
- 2. The model repeats the prompt or talks nonsense
- 3. First token takes forever
- 4. A small model streams slowly
- 5. JSON output keeps breaking
- 6. The model loops or never stops
- Optional deep cuts: newer serving layers worth watching
- NVIDIA Dynamo
- LMCache: tested on this Spark, with a surprise ending
- MAX by Modular
- ZML/LLMD alpha
- EXO
- MLX and mlxcel
- Wandler and WebGPU-style local servers
- What's coming next
Day 5 of the Local LLM series, tested on DGX Spark. A field guide to running serious models on a $4,699 box on your desk.
In Day 4, we learned how model numbers are stored: BF16, FP8, NVFP4, MXFP4, INT4, GGUF, and the rest of the 4-bit zoo.
Now comes the next layer.
You can have the right model and the right quantization format, and still get the wrong experience if you pick the wrong runtime.
This is the part people usually compress into one sentence:
"Just run it with Ollama."
That is a good start. It is not the whole story.
On a DGX Spark, the software layer decides:
- how the model is loaded into memory
- how requests are queued
- how multiple users share the GPU
- how the KV cache is stored
- whether shared prompts are reused
- whether speculative decoding is available
- whether NVFP4, FP8, MXFP4, or GGUF paths are actually fast
- whether your app sees an OpenAI-compatible API or a custom interface
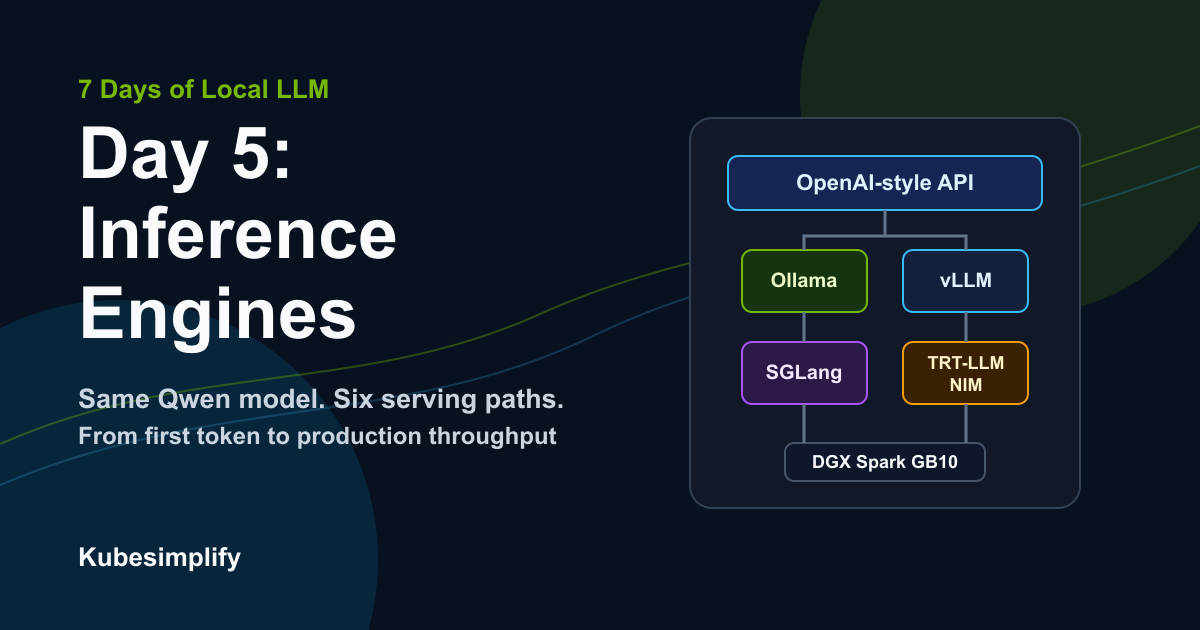
So Day 5 is about local LLM inference engines: Ollama, llama.cpp, vLLM, SGLang, Docker Model Runner, LM Studio, TensorRT-LLM, NIM, and the newer serving projects worth watching.
One sentence to keep in your head:
The model is the brain. The runtime is the factory floor that makes the brain useful.
First, what is inference? #
One word needs a plain definition before we compare tools: inference.
Training is when a model learns. The model reads huge amounts of text, makes predictions, gets things wrong, and slowly adjusts its internal numbers, called weights. Training changes the model. It is expensive, usually done on big clusters, and it is not what most people mean when they run a model on a desk machine.
Inference is when a trained model is used. The weights are already learned. They are loaded into memory, your prompt goes in, and the model uses those frozen weights to produce an answer one token at a time.
So the beginner version is:
- Training means teaching the model.
- Inference means using the model.
- Fine-tuning is a smaller kind of training where you adjust an existing model for a narrower task.
Every time you run ollama run, send a request to vLLM, or call a local OpenAI-compatible endpoint, you are doing inference.
That is why this post matters. Your Spark is not mostly valuable because it can train a frontier model from scratch. It is valuable because it can keep useful trained models close to your apps and run inference locally.
Then, what is an inference engine? #
Let us slow this down properly.
When you ask a local LLM a question, there are several layers involved. People often call all of them "the inference engine," but that is not quite right.
| Layer | Plain English | Example |
|---|---|---|
| Model file | The learned weights on disk | GGUF file, safetensors folder |
| Inference engine | The code that reads the weights and runs the math | llama.cpp, vLLM, SGLang, TensorRT-LLM |
| Serving wrapper | The CLI or server around the engine | Ollama, LM Studio, Docker Model Runner |
| API surface | The protocol your app talks to | OpenAI-compatible /v1/chat/completions |
| Application layer | The thing using the model | Hermes Agent, your app, a RAG service |
That distinction matters.
Ollama is not the same kind of thing as llama.cpp. Ollama is the friendly service and model registry. llama.cpp is the lower-level engine doing the actual GGUF inference underneath.
NIM is not the same kind of thing as TensorRT-LLM. NIM is NVIDIA's packaged, supported microservice. TensorRT-LLM is one of the high-performance backend engines NIM can use.
Hermes Agent is not an inference engine at all. It is an agent framework that calls a local serving endpoint underneath it.
If you remember this stack, the rest of the post becomes much easier.
Runtime stack
A request passes through more than one layer
The model file is only the bottom layer. Speed and reliability depend on the engine, the scheduler, the cache manager, and the API wrapper around it.
Chat UI, agent, curl, SDK
OpenAI-style HTTP surface
Scheduler, batching, cache manager
llama.cpp, vLLM, SGLang, TRT-LLM
GGUF or safetensors model files
Beginner mental model: Ollama and LM Studio make the stack easy to use. vLLM, SGLang, and TensorRT-LLM expose more of the serving machinery.
What happens when a request arrives #
This is the beginner version of the runtime job:
- Your app sends a prompt.
- The tokenizer turns the prompt into tokens.
- The runtime runs prefill, where the model reads the prompt and builds the KV cache.
- The runtime runs decode, where the model generates one token at a time.
- If more users arrive, the scheduler decides which requests get batched together.
- If prompts share a prefix, the cache manager may reuse old work.
- If speculative decoding is enabled, a draft path may guess future tokens and let the main model verify them.
- The server streams tokens back to your app.
So the runtime is not just "run matrix multiplication." It is a traffic controller, memory manager, model loader, API server, and performance engineer in one package.
This is why two setups on the same Spark can feel completely different.
Same GB10. Same unified memory. Similar model size. Wildly different runtime behavior.
Four clocks, not one speed number #
Before comparing engines, we need one more beginner mental model.
People often ask, "How fast did the model run?" But an inference request has at least four useful clocks:
| Clock | What it measures | What it feels like |
|---|---|---|
| Model startup | Time to load weights, compile kernels, and prepare memory | "Why is the server not ready yet?" |
| Time to first token (TTFT) | Time from sending the request until the first generated token arrives | "Why is the chat bubble still empty?" |
| Inter-token latency (ITL) | Delay between one generated token and the next | "How smoothly is the answer streaming?" |
| Aggregate throughput | Total tokens produced for all active users each second | "How many requests can this server handle together?" |
The prompt-reading phase, called prefill, has a large effect on TTFT. The one-token-at-a-time phase, called decode, controls the streaming rhythm after the first token appears. We built those stages from first principles in Day 2.
A runtime can win one clock and lose another. Ollama may feel wonderful for one person. vLLM may take longer to start but serve many simultaneous requests far more efficiently. A benchmark that prints only one tok/s number can hide that difference completely.
One request, four clocks
“How fast?” is not one question
The server can take time to start, the prompt can take time to read, tokens can stream slowly or quickly, and many users can share the same GPU.
Load weights, compile kernels, reserve memory.
Queueing, tokenization, and prefill happen here.
The rhythm you feel while the answer streams.
Total work completed across active requests.
A local chat benchmark mostly exposes TTFT and one-user decode. A serving benchmark must also measure concurrency, queueing, and total throughput.
For the controlled single-request tests in this post, I report output tokens divided by the full API request time. I call that wall output tok/s. When llama.cpp or Ollama also reports its internal decode rate, I show that separately. This prevents us from pretending two different measurements are the same thing.
The cast #
Here is the map for the rest of the post.
| Tool | What it really is | Easiest sentence |
|---|---|---|
| Ollama | Friendly local model service, mostly llama.cpp underneath | "Type two commands and chat." |
| llama.cpp | Low-level GGUF inference engine | "Power users who want every knob." |
| Docker Model Runner | Docker-native model runner and packaging flow | "Treat models like Docker artifacts." |
| LM Studio / llmster | Desktop and headless local model service | "Great UX, now Spark-friendly too." |
| vLLM | Production serving engine | "Best general API-serving path for teams." |
| SGLang | Serving engine built for structured and shared-prefix workloads | "When many requests reuse the same prompt prefix." |
| TensorRT-LLM | NVIDIA's high-performance inference library | "When you want the NVIDIA-optimized path and can handle setup." |
| NVIDIA NIM | Packaged NVIDIA inference microservice | "Supported container with tested model profiles." |
| Hermes Agent / agent frameworks | Application layer on top | "The thing using the runtime, not the runtime itself." |
Calling all of them "inference engines" would be inaccurate. This post is really about ways to serve LLMs on Spark, because some entries are engines, some are wrappers, and some are application layers.
Ollama: the easiest first step #
Ollama is still the best first run for most people.
On a Spark, DGX OS gives you the NVIDIA and Docker foundation, but Ollama is still a separate install:
curl -fsSL https://ollama.com/install.sh | shThen:
ollama pull nemotron-3-super
ollama run nemotron-3-superThat is the magic of Ollama. You are not thinking about safetensors folders, model loaders, Docker images, or server ports. You pull a model and start talking.
Under the hood, Ollama usually gives you a llama.cpp-style local inference path. Most of the models people run locally through Ollama are GGUF-style quantized artifacts, though Ollama hides a lot of that detail.
Ollama on Spark today: what I measured #
Early Spark testing was messy, and I once hit an older Ollama build that failed to offload correctly. That bug is not the current state of Ollama on Spark. Here is the current box:
nvidia-smi
# NVIDIA-SMI 580.159.03
# Driver Version: 580.159.03
# CUDA Version: 13.0
# GPU: NVIDIA GB10

ollama -v
# ollama version is 0.30.10The local model list is not toy-sized:
ollama list
# NAME                       ID              SIZE
# llama3.1:8b                46e0c10c039e    4.9 GB
# gemma4:26b                 5571076f3d70    17 GB
# qwen2.5vl:7b               5ced39dfa4ba    6.0 GB
# nemotron-3-super:latest    95acc78b3ffd    86 GB
# qwen3.5:35b-a3b 3460ffeede54 23 GBFor the controlled comparison, I pulled Qwen2.5 3B and confirmed the artifact:
ollama pull qwen2.5:3b
ollama show qwen2.5:3b
# parameters      3.1B
# quantization Q4_K_MThen I sent the fixed prompt through Ollama's local API. The num_predict option makes the 256-token output limit explicit:
curl -s http://127.0.0.1:11434/api/chat -d '{
  "model": "qwen2.5:3b",
  "messages": [{
    "role": "user",
    "content": "Explain Kubernetes Pods to an absolute beginner. Include a kitchen analogy, what containers inside one Pod share, how a Deployment uses Pods, and one practical example. Write at least 350 words and do not conclude early."
  }],
  "stream": false,
  "options": {
    "temperature": 0,
    "seed": 42,
    "num_predict": 256
  }
}' | jq '{load_duration, prompt_eval_count, prompt_eval_duration, eval_count, eval_duration}'The first request included model loading:
load duration:        5.344s
prompt eval count:    75 token(s)
prompt eval rate:     738.85 tokens/s
eval count:           256 token(s)
eval rate: 98.27 tokens/sAcross the next three warm requests, the engine-reported decode rates were 98.71, 99.14, and 99.52 tok/s. The first request measured 31.68 wall output tok/s including load, and the warm median was 93.74 wall output tok/s.
To reproduce the wall numbers, capture the full request time too: either wrap the curl in time, or add total_duration (nanoseconds for the whole request) to the jq field list and divide eval_count by it.
Always verify where the model actually landed:
ollama ps
# NAME          SIZE      PROCESSOR    CONTEXT
# qwen2.5:3b 3.4 GB 100% GPU 32768That confirms both the speed and the GPU path. But a 3B model is not why someone buys a 128 GB Spark. I also ran one large-model sanity check.
On the same Spark, with the 86 GB Ollama artifact already on disk:
ollama run nemotron-3-super:latest \
  "what is a docker container" \
--verboseThe output was a long answer, so this is not the same controlled 256-token test as the Qwen result above. But the decode number is still useful:
total duration:       1m6.807946086s
load duration:        307.733036ms
prompt eval count:    22 token(s)
prompt eval rate:     31.37 tokens/s
eval count:           1343 token(s)
eval rate: 20.45 tokens/sThat is a 120B-class mixture-of-experts model generating locally through Ollama at about 20 tok/s. "120B-class" describes all the stored parameters; only part of the model is active for each token. Earlier captures for this same 86 GB Ollama artifact landed around 17.71-19.5 tok/s, so the current result is a healthy confirmation, not an unexplained jump.
This run was done with no other active inference model loaded. The plain-English interpretation:
prompt evalis prefill: reading the input prompt and building the KV cache.evalis decode: generating the answer tokens.- For interactive chat,
eval rateis the number most people feel.
Ollama also publishes official DGX Spark benchmarks. The practical lesson is simple: current Ollama builds can use the Spark GPU well. If your run is unexpectedly slow, check ollama ps, ollama -v, model format, context size, and firmware/driver state before blaming the hardware.
When Ollama is the right choice #
Use Ollama when:
- you are one person chatting with one model
- you want the easiest install
- you want a huge model catalog
- you want a local endpoint that many tools already understand
- you are integrating an agent framework that already supports Ollama
Do not start with Ollama when:
- you need heavy multi-user batching
- you need every low-level runtime flag
- you need the fastest NVFP4 or FP8 production path
- you need strict production observability and scheduling control
Ollama exposes OpenAI-compatible APIs, including newer API surfaces in recent versions, but its strongest role is still local-first serving rather than a full production scheduler.
llama.cpp: the engine under the friendly wrappers #
llama.cpp is the C++ inference engine behind a huge part of local AI.
Ollama wraps it. LM Studio often wraps it. Docker Model Runner can use it. Many GGUF workflows eventually lead back to it.
If Ollama is the automatic car, llama.cpp is the manual gearbox.
Example:
docker run -d --name llama-server --gpus all -p 8080:8080 \
  -v /opt/models:/models \
  ghcr.io/ggml-org/llama.cpp:server-cuda \
  -m /models/gemma-3-27b-it-Q4_K_M.gguf \
  --n-gpu-layers 999 \
  --ctx-size 4096 \
--port 8080The flag --n-gpu-layers 999 means: put as much of the model as possible on the GPU path. If you are debugging CPU fallback, this kind of explicit control is useful.
llama.cpp gives you:
- GGUF model support, the compact quantized format from Day 4
- CPU, CUDA, Metal, Vulkan, and other backend paths depending on build, so the same GGUF file can run on a Spark, a MacBook, or a Raspberry Pi
- explicit GPU layer offload, meaning you decide how many of the model's layers live on the GPU. That is the
--n-gpu-layersflag above - an OpenAI-compatible server mode, so apps written for the OpenAI API can point at your Spark instead
- grammar and JSON-constrained decoding: you hand the server a grammar or JSON schema, and during generation it simply refuses any token that would break the format. As long as generation completes within its token budget and the grammar covers your schema features, the output stays parseable instead of "usually valid JSON"
- continuous batching, the request-packing idea explained with an example in the vLLM section below
- speculative decoding options, covered in their own section below
- a large ecosystem of quantized model files, because GGUF is the de facto community format for local models
The tradeoff is that llama.cpp exposes the sharp edges. You can tune it beautifully. You can also tune it into the floor.
Bare llama.cpp on Spark: what I measured #
Many people skip the wrapper and run llama-server directly. To make that comparison honest, I mounted the exact blob Ollama had just used.
You can see the blob path in Ollama's generated model file:
ollama show --modelfile qwen2.5:3b
# Look for the FROM /.../sha256-... line.That sha256-... file name is not random. Ollama stores models content-addressed, meaning the file is named by the hash of its own bytes. Which is exactly why this comparison is airtight: if llama.cpp opens that path, it is reading byte-for-byte the same artifact Ollama just served.
Then start the direct engine with that file mounted read-only:
OLLAMA_BLOB=/usr/share/ollama/.ollama/models/blobs/sha256-5ee4f07cdb9beadbbb293e85803c569b01bd37ed059d2715faa7bb405f31caa6

docker run -d --rm --name day5-llama-qwen3b \
  --gpus all \
  --ipc=host \
  -p 127.0.0.1:8080:8080 \
  -v "${OLLAMA_BLOB}:/models/qwen2.5-3b-q4_k_m.gguf:ro" \
  ghcr.io/ggml-org/llama.cpp@sha256:b58e2ecb2b3964080f1ca9662237ed92c2d267b0b0211c5eacfe3417ff1c20a1 \
  -m /models/qwen2.5-3b-q4_k_m.gguf \
  --ctx-size 4096 \
  --n-gpu-layers 99 \
  --flash-attn on \
  --parallel 1 \
  --port 8080 \
  --host 0.0.0.0 \
--jinjaThree flags in there deserve a plain explanation, because they are the kind of thing wrappers normally hide:
--flash-attn onenables FlashAttention, a smarter way to compute attention. Instead of building the full attention matrix in memory, it works through small tiles that stay in the GPU's fast on-chip memory. The attention it computes is mathematically equivalent, though reordered floating-point operations can produce tiny numerical differences. Less memory traffic, and the win grows with context length.--jinjatells the server to apply the model's own chat template, the Jinja-format wrapper that converts yourmessagesarray into the exact text layout the model was trained on, including its special role and turn markers. If a chat model ever ignores your question and just keeps completing your text, a missing or wrong chat template is one of the first things to check.--ipc=hoston the Docker side gives the container the host's shared-memory space. Docker's default shared-memory allowance is tiny, and multi-process inference servers that pass tensors between processes (vLLM, for example) can crash or slow down without it. Single-process llama.cpp does not normally need it; I kept the flag so every container in this post ran with the same Docker settings.
Wait for the server:
curl http://127.0.0.1:8080/healthThe @sha256 digest is Docker's immutable reference form. It pins the exact image I measured (the server-cuda tag at test time, llama.cpp build 9917), because server-cuda itself is a mutable tag that moves with new releases.
Then send the same fixed request. This small Python snippet works with any OpenAI-compatible chat endpoint; change only url and model:
python3 - <<'PY'
import json
import time
import urllib.request

payload = {
    "model": "qwen2.5-3b-q4_k_m.gguf",
    "messages": [
        {
            "role": "user",
            "content": "Explain Kubernetes Pods to an absolute beginner. Include a kitchen analogy, what containers inside one Pod share, how a Deployment uses Pods, and one practical example. Write at least 350 words and do not conclude early."
        }
    ],
    "max_tokens": 256,
    "temperature": 0,
    "seed": 42,
    "stream": False,
}

request = urllib.request.Request(
    "http://127.0.0.1:8080/v1/chat/completions",
    data=json.dumps(payload).encode(),
    headers={"Content-Type": "application/json"},
)

start = time.time()
with urllib.request.urlopen(request, timeout=240) as response:
    result = json.loads(response.read())
elapsed = time.time() - start

completion_tokens = result["usage"]["completion_tokens"]
print("completion_tokens:", completion_tokens)
print("elapsed_s:", round(elapsed, 3))
print("wall_decode_tok_s:", round(completion_tokens / elapsed, 2))
PYRun the request three times after the first call, then check llama.cpp's own decode timing:
docker logs day5-llama-qwen3b 2>&1 | grep "eval time" | tail -4The first request took 17.689s wall time. The next three took 2.515s, 2.521s, and 2.523s for 256 output tokens. That gives a warm median of 101.55 wall output tok/s. llama.cpp's own warm decode median was 102.26 tok/s.
The direct path was about 8% ahead of Ollama's full-request wall number in this tiny, sequential test. That is measurable, but it is not a reason to abandon Ollama. Ollama is doing useful wrapper work: model discovery, manifests, lifecycle management, defaults, and a friendly CLI. Bare llama.cpp gives you the knobs and removes some wrapper overhead.
I also ran a much larger Qwen3.6-27B-Q4_K_M artifact directly. Its server-side baseline was:
eval time = 20170.43 ms / 256 tokens (78.79 ms per token, 12.69 tokens per second)That second result is not part of the six-path comparison. It is here because the same 27B checkpoint appears in the speculative-decoding work below, and our 12.69 tok/s baseline closely matches the PR author's 12.57 tok/s Spark baseline.
Cleanup:
docker rm -f day5-llama-qwen3bThe point is not just the number. Direct llama.cpp is a real server path, and it gives you lower-level control over model files, context length, batching, flash attention, GPU offload, chat templates, and speculative decoding.
Speculative decoding and MTP, in plain English #
This is important enough to pause on.
Normal decode is slow because the big model usually produces one token at a time.
The model reads the active weights, produces scores, picks one next token, appends it, and repeats.
Speculative decoding tries to cheat that loop.
The idea:
- A cheap draft path guesses several future tokens.
- The big model checks those guessed tokens in one bigger pass.
- Accepted tokens are kept.
- Rejected tokens are thrown away and the runtime falls back.
If the guesses are good, you get multiple output tokens for something closer to one expensive big-model step.
If the guesses are bad, you wasted work.
That is the whole idea.
Speculative decoding
The big model can verify more than one guessed token
Normal decode asks the big model for one token at a time. Speculative decoding uses a cheap guesser, or native MTP heads, to propose several tokens and lets the big model verify them together.
Normal decode
One expensive memory read produces one output token. Simple, reliable, but bandwidth-bound.
Speculative path
The draft path guesses ahead. The big model checks the proposed tokens in one larger pass.
The catch: it only helps when the draft guesses are often accepted. Wrong drafter, wrong checkpoint, or low acceptance rate can make it slower.
There are different ways to create the draft tokens:
| Method | Simple meaning |
|---|---|
| Small draft model | A smaller model guesses ahead; the large model verifies. |
| MTP heads | The main model has extra heads trained to predict future tokens. |
| N-gram draft | The runtime looks for repeated token patterns in the current context. |
| DFlash | A draft model proposes a whole block of candidate tokens in one pass, then the target verifies. |
| EAGLE / Medusa-style methods | More advanced draft-and-verify families used by some serving stacks. |
llama.cpp documents speculative decoding and includes a draft-mtp mode:
llama-server \
  -m model-with-mtp.gguf \
  --n-gpu-layers 999 \
  --spec-type draft-mtp \
--spec-draft-n-max 2And this part is moving fast. On June 28, 2026, llama.cpp merged PR #22105, adding DFlash speculative decoding support with --spec-type draft-dflash:
llama-server \
  -m target-model.gguf \
  -md dflash-draft-model.gguf \
  --spec-type draft-dflash \
  --spec-draft-n-max 15 \
  -ngl 99 \
-fa onThat PR includes a Spark-relevant SpeedBench result: Qwen3.6-27B and its DFlash draft, both Q4_K_M, tested on DGX Spark. The overall decode number moved from 12.57 predicted tok/s to 33.76 predicted tok/s, a 2.69x decode speedup. Some categories were higher, such as RAG at 4.07x and coding at 3.11x.
Treat this as bleeding edge, not a normal "copy this command and it works everywhere" feature. DFlash is now merged into llama.cpp master and documented there, but your installed release or container may not include it yet. The target model, draft model, runtime build, and GGUF metadata all have to line up.
I did not run the DFlash path on my Spark for this post. I ran the ordinary 27B baseline and verified that it matched the PR baseline closely; the 2.69x result reported here belongs to the PR author's Spark test. That distinction matters.
So the honest Day 5 takeaway is:
Speculative decoding is no longer only a research-paper idea or a hosted-inference trick. It is landing in local runtimes too. But it needs the right model, the right draft artifact, and a workload where the draft tokens are accepted often enough.
This is not a guaranteed "2x flag":
Speculative decoding can speed up decode when the model, draft path, and runtime match well. It can also do nothing or slow you down if acceptance is poor. Benchmark your checkpoint.
Speculative decoding belongs in an engine guide because it is not just a model feature. The engine has to support the draft path, schedule the verification pass, and report whether it actually helped.
Docker Model Runner: Docker-native local models #
Docker Model Runner is for people who want models to behave like Docker artifacts.
The mental model:
docker model pull ai/gemma3
docker model run ai/gemma3 "Explain Kubernetes pods in one paragraph."That feels very different from managing a Python environment or custom inference server.
Docker's current docs describe Docker Model Runner as supporting:
- pulling models from Docker Hub
- pulling from OCI-compatible registries
- pulling from Hugging Face
- serving OpenAI-compatible and Ollama-compatible APIs
- llama.cpp, vLLM, and Diffusers inference engines, with platform-specific support
The important Spark nuance is platform support. Docker's docs list llama.cpp as the default engine across platforms, while the vLLM backend has stricter platform requirements. On a DGX Spark ARM64 box, treat Docker Model Runner mainly as the Docker-native GGUF/llama.cpp path unless the backend docs for your version explicitly say the vLLM runner is Spark/ARM64 ready.
That changes the framing. Hugging Face support exists. The real distinction is packaging and workflow: Docker Model Runner makes the Docker-native path cleaner.
On my Spark, Docker Model Runner was already running, with client 1.1.37 and server 1.1.11:
docker ps
# docker-model-runner docker/model-runner:latest-cuda Up 12 hours 127.0.0.1:12434->12434/tcpThe runner logs made the active Spark backend clear:
installed llama-server gpuSupport=true
Backend installation failed for backend=vllm error="vLLM binary not found"
Backend installation failed for backend=sglang error="python3 not found in PATH"So for this Spark, Docker Model Runner was not "vLLM hidden inside Docker." It was the Docker-native llama.cpp/GGUF path.
For the controlled test, I packaged the exact same Ollama GGUF blob as a Docker model. The temporary symlink gives the content-addressed blob a .gguf filename that the packager recognizes:
mkdir -p ~/models/day5-qwen25
ln -s /usr/share/ollama/.ollama/models/blobs/sha256-5ee4f07cdb9beadbbb293e85803c569b01bd37ed059d2715faa7bb405f31caa6 \
  ~/models/day5-qwen25/qwen2.5-3b-q4_k_m.gguf

docker model package \
  --gguf ~/models/day5-qwen25/qwen2.5-3b-q4_k_m.gguf \
  --context-size 4096 \
day5-qwen25:3b-q4kmdocker model inspect identified it as a 3.09B-parameter Qwen2.5 Instruct artifact, MOSTLY_Q4_K_M, 1.79 GiB. I then sent the same JSON request (the same Python snippet once more, with url pointing at the endpoint below and model set to the packaged model name) to Docker Model Runner's engine-specific endpoint:
http://127.0.0.1:12434/engines/llama.cpp/v1/chat/completionsThe first request returned 256 tokens in 4.666s, including model loading. The next three took 2.587s, 2.583s, and 2.568s, giving 99.11 wall output tok/s at the median. The backend's warm decode median was 100.05 tok/s.
That near-match with bare llama.cpp is exactly what we should expect. Docker Model Runner's value here is the Docker workflow, packaging, lifecycle, and API, not a mysterious new math engine.
After testing, unload and remove the temporary model:
docker model unload day5-qwen25:3b-q4km
docker model rm day5-qwen25:3b-q4km
rm ~/models/day5-qwen25/qwen2.5-3b-q4_k_m.gguf
rmdir ~/models/day5-qwen25Use Docker Model Runner when:
- your app already runs in Docker Compose
- you want a consistent local developer workflow
- you want to package and move model artifacts through OCI-style tooling
- you want llama.cpp-style local inference without hand-managing llama.cpp
Do not pick it when:
- you need every low-level engine flag
- you are chasing the newest model architecture on day one
- you need the most mature production scheduler
LM Studio and llmster: GUI when you want it, headless when you do not #
LM Studio used to be easy to summarize as "the GUI one."
That is still true, but incomplete.
LM Studio now has official DGX Spark support through NVIDIA's Spark playbook, and that playbook uses llmster, a headless terminal-native LM Studio daemon.
So "avoid LM Studio for headless" is outdated advice.
The better framing:
LM Studio is the most approachable local model experience, and llmster lets the same ecosystem run headless on Spark.
Use LM Studio when:
- you want a polished UI
- you want to browse, download, and test models interactively
- you want a local API server without hand-building one
- you want to access Spark-hosted models from a laptop through the LM Studio ecosystem
Use something else when:
- you want raw llama.cpp flags
- you are building a high-concurrency API service
- you need a runtime that exposes detailed scheduler and cache tuning
vLLM: the general production-serving workhorse #
vLLM is the first serious jump from "local chat" to "serving."
It is not just faster because it has better kernels. It is faster because it is built around serving many requests efficiently.
vLLM gives you:
- continuous batching, explained just below with an example
- PagedAttention for KV cache management, explained just below with an example
- prefix caching: when a new prompt starts with the same text as an earlier one, the engine reuses the earlier prefill work instead of recomputing it
- chunked prefill, explained below
- an OpenAI-compatible API server
- structured outputs: you attach a JSON schema to a request and the engine forces the generated tokens to match it, so a response like
{"severity": "high", "restart": true}parses reliably when generation finishes within the token limit and the schema features are supported, the same constrained-decoding idea llama.cpp offers through grammars - tool calling support, the mechanism that lets a model reply "call this function with these arguments" in a machine-readable way, which is what agent frameworks build on
- speculative decoding support, covered in its own section above
- multi-LoRA serving: LoRA adapters are small fine-tuned add-on weights. vLLM keeps one base model loaded and applies a different adapter per request, so ten team-specific model variants do not need ten full copies of a model in memory
- quantization paths including FP8, MXFP4, NVFP4, INT4, GGUF, and more, the formats from Day 4
That list matters because production serving is a queueing problem.
One request comes in. Another starts. A third has a long prompt. A fourth is already decoding. The runtime has to keep the GPU busy without letting one request block the whole line.
That is what continuous batching is for.
Instead of running:
request A -> request B -> request C
the engine can pack active work together:
A token 1 + B token 1 + C prefill + D token 1
That is why vLLM can look worse for a single user but much better for many users.
PagedAttention, in plain English #
Now the other headline feature, because "paged KV cache management" deserves better than a bullet point.
The KV cache from Day 2 grows token by token while a request runs, and the server cannot know in advance how long any conversation will get.
The naive approach reserves one big contiguous memory block per request, sized for the worst case. Suppose a request reserves room for 4,096 tokens and the conversation only ever reaches 900. The remaining 3,196 slots sit empty, and because the block is contiguous and private, no other request can use them. Serve a handful of users this way and the GPU runs out of "reserved but unused" memory long before it runs out of real capacity. In our example, one request wasted more than three quarters of its reservation, and every concurrent request wastes its own share.
PagedAttention borrows the fix from operating systems. It splits the KV cache into small fixed-size blocks, like memory pages, and hands them out on demand. Our 900-token conversation now occupies about 57 blocks of 16 tokens each (vLLM's default block size) instead of one 4,096-token slab. The moment the request finishes, its blocks return to the shared pool. Blocks do not need to sit next to each other in memory, so external fragmentation is greatly reduced, and far more concurrent requests fit into the same GPU memory.
So the two ideas divide the work: continuous batching keeps the compute busy, PagedAttention keeps the memory honest. Together they are most of the reason vLLM behaves so well when requests overlap.
Chunked prefill, in plain English #
One more scheduler idea from the feature list, and you already know the ingredients.
Imagine your answer is streaming smoothly, and a teammate submits an 11,000-token document to the same server. Prefill for that document is a big, dense chunk of work. If the engine processes it in one go, every other user's stream freezes until it finishes.
Chunked prefill slices the big prompt into pieces and interleaves those pieces with everyone else's decode steps. The big document may take a little longer to be read, and everyone else's streams stay much smoother, with the balance tunable through max_num_batched_tokens. On a Spark you share with teammates, this is the difference between "smooth" and "the server hiccups whenever someone pastes a log file."
For the controlled test, I used vLLM 0.25.1, pinned by tag so you run the same build I measured, with the BF16 Qwen checkpoint:
docker run -d --rm --name day5-vllm-qwen3b --gpus all --ipc=host -p 8000:8000 \
  -v /home/saiyam/.cache/huggingface:/root/.cache/huggingface \
  vllm/vllm-openai:v0.25.1 \
  Qwen/Qwen2.5-3B-Instruct \
  --dtype bfloat16 \
  --max-model-len 4096 \
  --gpu-memory-utilization 0.85 \
--seed 42It loaded the same cached Hugging Face snapshot later used by SGLang. Server startup took about 156s end to end: roughly 39s to read the 5.79 GiB of weights, about 72s of engine init covering profiling, compilation, KV-cache setup, and CUDA graph capture, and the rest in container and API server startup. The CUDA graph part is worth a one-line explanation: generating a token normally means the CPU issuing thousands of small GPU instructions, so the engine records the whole launch sequence once as a "graph" and then replays it cheaply for every token.
To measure it yourself, reuse the Python snippet from the llama.cpp section: set url to http://127.0.0.1:8000/v1/chat/completions and model to Qwen/Qwen2.5-3B-Instruct, run it once cold, then three more times. When you are done, docker stop day5-vllm-qwen3b stops the container, and --rm removes it.
The first API request took 8.062s, or 31.75 wall output tok/s. The next three took 8.042s, 8.050s, and 8.079s, for a warm median of 31.80 tok/s. Cold and warm match because vLLM 0.25.1 does its heavy compilation during startup instead of on your first request.
Two practical notes before the results. Pin the image version instead of using latest: Docker only downloads a tag it does not already have, so an old latest sitting on your box will silently run an older vLLM. An earlier pass of this test did exactly that and landed on vLLM 0.19.0, which printed a PyTorch warning that it supported at most cuda capability 12.0 (the GB10 is 12.1) and spent 26.8s on the first request compiling kernels on first use. Both are fixed in current builds. And for NVFP4, MoE, or larger-model work, prefer a Spark-validated image over assuming a generic container has the right sm_121 kernels.
Now the production-serving point. In a separate earlier sweep with the same Qwen2.5 3B BF16 family and 512 output tokens per request, aggregate throughput climbed as concurrent requests were batched:
| Concurrent requests | Aggregate output throughput |
|---|---|
| 1 | 26.14 tok/s |
| 8 | 246.79 tok/s |
| 32 | 851.84 tok/s |
| 64 | 1,462.30 tok/s |
That older sweep used a different date, build, output length, and benchmark goal, so do not splice it into the six-path comparison. It answers a different question: what can the scheduler do when work overlaps? Aggregate throughput rose enormously even though one user's stream did not become 56 times faster.
That is why "vLLM is slower than Ollama" is the wrong conclusion. Q4 GGUF versus BF16 explains much of the single-request gap, while vLLM's scheduling value appears under concurrency.
The vLLM image problem on Spark #
On Spark, the Docker image can matter as much as the model.
The Spark is ARM64. The GPU is Blackwell GB10 with sm_121. CUDA 13 and model architecture support have moved quickly. If your vLLM image does not include the right kernels or architecture support, performance can be much worse than the hardware should allow.
This has improved since the earliest Spark experiments. vLLM now has a DGX Spark-specific writeup, and NVIDIA has a Spark vLLM playbook with a current support matrix. Start there before trying random containers.
The practical wording is:
vLLM is one of the strongest production-style serving paths on Spark, but the exact image, model recipe, CUDA build, and kernel support are load-bearing. Treat upstream, NVIDIA, and community images as different runtime builds, not interchangeable wrappers.
Use vLLM when:
- you are serving a small team or app
- concurrency matters
- OpenAI-compatible APIs matter
- structured output or tool calling matters
- you want Hugging Face safetensors model support
- you can spend time choosing the correct image and runtime flags
Do not start with vLLM when:
- you only want local chat
- you do not want Docker/runtime debugging
- your model only has a GGUF path and llama.cpp already serves it well
SGLang: when many requests share the same prefix #
SGLang is a serving framework for structured generation and agentic workloads.
The key idea is RadixAttention.
Plain English:
If 100 requests share the same system prompt, do not process that system prompt 100 times.
Cache the shared prefix once. Reuse it.
Example:
Shared prefix:
You are a Kubernetes assistant. Use these tools...

Request A:
...explain pods

Request B:
...explain services

Request C:
...debug this YAMLA normal runtime may repeat a lot of prefill work. SGLang is designed around reusing common prefixes through a radix-tree-style cache.
This is especially useful for:
- multi-agent systems
- RAG systems with shared instructions
- tool-calling systems with repeated tool schemas
- evaluation workloads with repeated few-shot examples
- long system prompts reused across many short user turns
NVIDIA also publishes an official SGLang playbook for DGX Spark, so the old "you must build from source" warning is no longer the right default. Start with the official Spark playbook unless you need a specific patch.
For the controlled test, I used SGLang's CUDA 13 Spark image (the latest-cu130 tag at test time, pinned below by its immutable digest) and the exact same cached BF16 checkpoint used by vLLM:
docker run -d --rm --name day5-sglang-qwen3b \
  --gpus all \
  --ipc=host \
  -p 127.0.0.1:30000:30000 \
  -v /home/saiyam/.cache/huggingface:/root/.cache/huggingface \
  lmsysorg/sglang@sha256:00c53fe4c31bf22d7b37537f28bbdfd924c02de13cdfb4bff7378c9c34d75ab2 \
  python3 -m sglang.launch_server \
  --model-path Qwen/Qwen2.5-3B-Instruct \
  --host 0.0.0.0 \
  --port 30000 \
  --dtype bfloat16 \
  --context-length 4096 \
  --attention-backend flashinfer \
  --mem-fraction-static 0.75 \
--random-seed 42Measurement is the same routine again: the Python snippet from the llama.cpp section with url set to http://127.0.0.1:30000/v1/chat/completions and model set to Qwen/Qwen2.5-3B-Instruct, one cold run plus three warm. docker stop day5-sglang-qwen3b cleans up afterward.
The image reported SGLang 0.5.15.post1. Startup took about 82s, including a 34s weight load and graph capture. The first API request returned 256 tokens in 9.068s, or 28.23 wall output tok/s. The next three took 8.264s, 8.086s, and 8.062s, for a warm median of 31.66 tok/s.
That is almost the same as vLLM's 31.80 tok/s, which is a healthy result. This test used one request at a time and did not give SGLang repeated prefixes to exploit. It confirms the basic BF16 path; it does not benchmark RadixAttention's actual advantage.
The startup logs exposed one excellent beginner lesson. With --mem-fraction-static 0.75, SGLang reserved about 80 GiB for key and value caches even though the 3B weights needed only about 6 GiB. That flag is a budget, not a speed setting. A large cache can support long contexts or more concurrent requests, but on unified-memory Spark it also leaves less room for other models and applications. Size it for your workload instead of copying 0.75 blindly.
The tested module command also printed a notice that sglang serve is now the recommended CLI. I have shown the exact command I ran for reproducibility; for a fresh deployment, follow the current Spark playbook syntax.
Use SGLang when:
- your workload has repeated prompt prefixes
- you are building agents
- you care about structured generation
- you are willing to learn a newer serving stack
Use vLLM or Ollama when:
- every prompt is unique
- you only need single-user chat
- you want the largest beginner support surface
TensorRT-LLM: NVIDIA's performance path #
TensorRT-LLM deserves its own entry because it is a different level of the stack.
It is not a friendly first-run tool like Ollama. It is NVIDIA's open-source library for optimizing LLM inference on NVIDIA GPUs.
NVIDIA's DGX Spark playbook for TensorRT-LLM says the goal directly: install and use TensorRT-LLM on Spark for lower latency and higher throughput through kernel-level optimizations, efficient memory layouts, and advanced quantization.
Those words deserve a plain-English translation. TensorRT-LLM's heritage is compilation: the classic flow built the model ahead of time into a fixed engine for one exact GPU, fusing operations together, picking kernels tuned for that specific architecture, and locking in the memory layout. Think of compiling a program with every optimization flag turned on for one specific CPU. You paid with setup time and lost flexibility, and won on latency and throughput.
Current TensorRT-LLM 1.x has softened that trade. The default runtime is now PyTorch-based, so serving no longer requires an offline engine-build step, and the NVIDIA-specific value lives in the optimized kernels, CUDA graphs, and quantization recipes it brings along. What has not changed is the philosophy: TensorRT-LLM works best when you stay on combinations NVIDIA has validated, which is exactly why the Spark playbook publishes a support matrix per model and precision.
One version note: the support matrix below comes from NVIDIA's current Spark playbook, which tracks newer TensorRT-LLM builds than the 1.2.1 stable release I used for the controlled benchmark further down.
It supports Spark model paths such as:
- Nemotron 3 Nano Omni BF16, FP8, and NVFP4
- Nemotron 3 Super 120B NVFP4
- GPT-OSS 20B and 120B MXFP4
- Llama 3.1 8B FP8 and NVFP4
- Llama 3.3 70B NVFP4
- Qwen3 variants
- Llama 4 Scout NVFP4
- two-Spark Qwen3 235B-A22B NVFP4 path
That does not mean every random Hugging Face model will work out of the box. It means TensorRT-LLM is a serious Spark path when your model is supported and you are willing to work closer to NVIDIA's optimized stack.
TensorRT-LLM on Spark: what I measured #
TensorRT-LLM's old reputation is that you must build an engine offline before you can serve anything. Single-node serving is simpler now: trtllm-serve in the release container takes the Hugging Face model handle directly, and no separate engine-build step was needed for this run. That is because this run used TensorRT-LLM's default PyTorch backend; the classic compiled-TensorRT-engine path still exists as a separate backend, and you can pin the default explicitly with --backend pytorch.
docker run -d --name day5-trtllm-qwen3b --gpus all --ipc=host -p 8000:8000 \
  -v /home/saiyam/.cache/huggingface:/root/.cache/huggingface \
  nvcr.io/nvidia/tensorrt-llm/release:1.2.1 \
trtllm-serve Qwen/Qwen2.5-3B-Instruct --host 0.0.0.0 --port 8000The server reported TensorRT LLM version 1.2.1 and was ready in about 80s, roughly half of vLLM's 156s startup. Then the exact same controlled test as the other paths: same cached BF16 checkpoint, same prompt, 256 output tokens, temperature 0, seed 42, one cold plus three warm requests, sent with the same Python snippet from the llama.cpp section (url on port 8000, model set to Qwen/Qwen2.5-3B-Instruct).
- first request: 256 tokens in
8.238s,31.07 wall output tok/s - next three:
8.250s,8.279s,8.273s, a warm median of30.94 wall output tok/s
Read that honestly: all three engines landed within 0.86 tok/s of each other in this small batch-one sample (vLLM 31.80, SGLang 31.66, TensorRT-LLM 30.94), which is consistent with bandwidth-bound decode. For one BF16 request at a time, "NVIDIA's performance path" was not faster here. All three engines are pushing the same bytes through the same 273 GB/s of unified memory, so once the artifact and precision are fixed, single-request decode leaves an engine very little room to differentiate.
Where TensorRT-LLM is built to earn its name is everything this little test deliberately excluded: the NVFP4 and FP8 quantized paths in the support matrix, speculative decoding variants, and batched serving. Those are separate, bigger experiments.
Cleanup:
docker rm -f day5-trtllm-qwen3bUse TensorRT-LLM when:
- you want to benchmark the NVIDIA-optimized path
- your model is in the Spark support matrix
- you care about FP8, FP4, KV cache handling, kernel-level tuning, and speculative decoding variants like MTP and EAGLE (EAGLE, like MTP, is a draft-and-verify method from the speculative decoding family explained earlier)
- setup complexity is acceptable
Use something else when:
- you want the easiest first local chat
- you are still exploring models
- your target model is not supported yet
NVIDIA NIM: packaged and supported serving #
NIM stands for NVIDIA Inference Microservice.
The simple version:
NIM is a model-serving container with NVIDIA's supported packaging around it.
It exposes an HTTP inference endpoint, handles containerized deployment, and gives you a more enterprise-shaped runtime story than hand-rolling an engine container yourself.
A common shortcut is to say "NIM is TensorRT-LLM under the hood" or "NIM is only for Nemotron." That is too absolute.
Current NIM documentation and NVIDIA/Hugging Face material describe NIM as a serving layer that can select among backends such as TensorRT-LLM, vLLM, or SGLang depending on model/profile. A "profile" is a pre-tuned bundle of model, precision, backend engine, and target hardware that NVIDIA has validated together, so you deploy a known-good combination instead of assembling one by hand. NVIDIA's Spark NIM playbook also mentions Llama 3.1 8B and Qwen3-32B options, not just Nemotron.
The accurate mental model is:
NIM is the right choice when NVIDIA has a tested NIM/profile for the model you want and you care about support, packaging, metrics, health checks, and standard operations more than maximum tinkering freedom.
Use NIM when:
- you want NVIDIA-supported containers
- you are in an enterprise or production setting
- your target model has a tested NIM/profile
- you want a hardened API service with operations built in
Do not use NIM as the first beginner path when:
- you are casually exploring local models
- you do not have NGC access
- you want to run arbitrary community checkpoints
- you want to tweak every engine flag directly
Hermes Agent, NemoClaw, OpenClaw: not engines, but still important #
Agent frameworks sit above the runtime.
They do not replace Ollama, LM Studio, vLLM, or NIM. They call them.
Hermes Agent is a good example. NVIDIA's current Spark playbook connects Hermes to a local model served by vLLM. NemoClaw's Spark playbook also routes inference to local vLLM now (it previously used Ollama). OpenClaw can also sit on top of a local OpenAI-compatible endpoint. The important point is the same in all cases: the agent layer handles tool use, task loops, and local workflow logic. The runtime underneath still does the token generation.
The same mental model applies to NemoClaw, OpenClaw, custom RAG apps, coding agents, and your own tools.
The clean framing is:
Hermes is a reason you need a runtime. It is not the runtime itself.
This is a nice bridge to Day 7, where the local lab becomes an actual workflow.
The fairest comparison I could make on one Spark #
The obvious question is: why not run the same model through every path?
That is exactly what I did with Qwen2.5-3B-Instruct. But "the same model" still needs one careful explanation.
The learned model can be packaged in different files:
- GGUF Q4_K_M stores a compressed 4-bit version used by llama.cpp-style engines.
- BF16 safetensors stores the model at 16-bit precision and is the normal Hugging Face path for vLLM and SGLang.
Those files come from the same Qwen2.5 3B Instruct model, but they do not move the same number of bytes through memory. Comparing Q4 directly with BF16 would mix the effect of the engine with the effect of the format.
So I used two honest lanes.
Lane A: the exact same GGUF file #
Ollama stores its pulled model as a content-addressed blob. I mounted that exact Qwen2.5-3B-Instruct Q4_K_M blob read-only into bare llama.cpp, then packaged the same blob for Docker Model Runner. No second conversion. No similarly named download.
| Serving path | First request wall output | Warm median wall output | Engine-reported warm decode |
|---|---|---|---|
Ollama 0.30.10 | 31.68 tok/s | 93.74 tok/s | 99.14 tok/s |
bare llama.cpp, build 9917 | 14.47 tok/s | 101.55 tok/s | 102.26 tok/s |
Docker Model Runner 1.1.11 | 54.86 tok/s | 99.11 tok/s | 100.05 tok/s |
The warm numbers are close because all three paths eventually use the same compact GGUF weights and llama.cpp-family compute path. The wrappers change loading, packaging, defaults, APIs, and operations. They do not magically change a 3B model into different math.
Lane B: the exact same BF16 checkpoint #
For vLLM, SGLang, and TensorRT-LLM, I mounted the same cached Hugging Face snapshot of Qwen/Qwen2.5-3B-Instruct and served it as BF16.
| Serving path | First request wall output | Warm median wall output | What this path adds |
|---|---|---|---|
vLLM 0.25.1 | 31.75 tok/s | 31.80 tok/s | Paged KV cache, continuous batching, production API controls |
SGLang 0.5.15.post1 | 28.23 tok/s | 31.66 tok/s | Radix prefix cache and structured-serving controls |
TensorRT-LLM 1.2.1 | 31.07 tok/s | 30.94 tok/s | NVIDIA-optimized kernels, FP8/NVFP4 recipes, MTP and EAGLE paths |
Their warm single-request speeds are nearly identical, all three within about one token per second. That does not mean these engines are the same. Their real differences appear when requests overlap, prefixes repeat, schemas constrain output, quantized formats come into play, caches fill, and operators need metrics and control.
The test protocol #
Every path ran alone. I unloaded or stopped one runtime before starting the next.
- same Spark, driver
580.159.03, NVIDIA GB10 - same prompt, 75 input tokens
- exactly 256 requested output tokens
- temperature
0, seed42 - one first request, then three warm sequential requests
- warm result is the median of those three requests
- no concurrency during this comparison
This table answers: how do these paths behave for one controlled local request? It does not answer: which server wins at 32 simultaneous users? The concurrency sweep in the vLLM section above showed that distinction.
The most useful result is not a winner. It is this:
Keep the artifact fixed when comparing wrappers. Keep the precision fixed when comparing engines. Then test the workload you actually care about.
Every number in these tables comes from the exact commands, flags, and measurement steps shown in the engine sections above, so you can redo the whole comparison on your own Spark.
The honest comparison table #
The controlled numbers are in the two-lane tables in the previous section. This final table answers a different question: what kind of job is each path built to do?
| Path | Best for | Single-user feel | Multi-user serving | Setup pain | Spark status |
|---|---|---|---|---|---|
| Ollama | first local chat | strong | basic to moderate | low | official path; Q4 tested here |
| llama.cpp | GGUF power users | strong | moderate | medium | direct CUDA/GGUF tested here |
| Docker Model Runner | Docker-native workflows | strong | moderate, backend-dependent | low to medium | ARM64 llama.cpp path tested here |
| LM Studio / llmster | GUI or headless local service | strong | small-team API | low | official Spark playbook |
| vLLM | team API serving | model-dependent | strong | medium to high | BF16 tested here; image matters |
| SGLang | agents and shared prompts | model-dependent | strong when prefixes repeat | medium to high | BF16 tested here; official playbook |
| TensorRT-LLM | NVIDIA optimized path | strong when supported | strong | high | official Spark playbook |
| NIM | supported packaged serving | strong when profiled | strong | medium | best with tested model profile |
| Dynamo | distributed orchestration | not the point | very strong at scale | high | watch for multi-Spark/larger systems |
| ZML/LLMD alpha | cross-hardware serving | promising, unbenchmarked here | unknown | medium | smoke-tested on Spark with Qwen3 0.6B |
And here is the simple version:
Choose by workload
The right engine depends on the shape of the workload
Single-user chat, batched API serving, shared-prefix agents, and supported NVIDIA deployments optimize for different things.
Chat
Ollamafastest start
Knobs
llama.cppraw control
Team API
vLLMbatching wins
Shared prompts
SGLangprefix reuse
NVIDIA path
TRT-LLM / NIMsupported stack
Docker-native
DMROCI workflow
This is why the post says "ways to serve" instead of pretending every box is the same kind of engine.
My practical decision tree #
If you remember nothing else:
- Just chatting on Spark: start with Ollama.
- You want GUI or a friendly local server: use LM Studio or
llmster. - You want raw GGUF control: use llama.cpp directly.
- You are Docker-native: try Docker Model Runner.
- You are serving a team or app: use vLLM.
- Your prompts repeat across agents or tools: evaluate SGLang.
- Your model is in NVIDIA's Spark TensorRT-LLM matrix: benchmark TensorRT-LLM.
- You need NVIDIA-supported packaged serving: use NIM.
- You are thinking multi-Spark or larger distributed serving: watch Dynamo.
The six things that go wrong #
Once readers run these engines, six failure patterns appear repeatedly.
1. CUDA out of memory #
The model loads, then dies. Or it runs until the prompt gets longer, then dies.
Most likely cause: the model weights fit, but the KV cache does not. A long context window can eat memory quickly, especially with concurrency.
First fixes:
- reduce context length
- lower
--max-model-lenin vLLM - lower
num_ctxin Ollama - try FP8 KV cache if your engine supports it
- use a smaller model or smaller quantization
2. The model repeats the prompt or talks nonsense #
Most likely cause: wrong chat template.
A base model and an instruct model are not the same thing. A model trained with one chat wrapper may behave badly if you send a different wrapper.
First fixes:
- confirm you pulled the instruct/chat variant
- use the model card's chat template
- prefer
/v1/chat/completionsover raw completions for chat models
3. First token takes forever #
Most likely cause: prefill is doing real work.
A long prompt has to be read before generation starts. If your system prompt is 20,000 tokens, the runtime is not frozen. It is building the KV cache.
First fixes:
- shorten the system prompt
- enable or verify prefix caching
- warm the model with a representative prompt
- separate "load time" from "first-token latency"
4. A small model streams slowly #
Most likely cause: CPU fallback or wrong GPU path.
First fixes:
- check
ollama psfor GPU use - check container logs for CUDA or kernel fallback
- confirm your image supports ARM64 and Spark's Blackwell path
- verify the model was not partly spilled to CPU by accident
5. JSON output keeps breaking #
Most likely cause: you are asking a probabilistic model to freestyle a strict schema.
First fixes:
- set temperature near zero
- use structured output or grammar-constrained decoding
- use a tool-tuned model
- validate and retry in the app
6. The model loops or never stops #
Most likely cause: stop tokens or sampling settings.
First fixes:
- check the model's expected stop tokens
- add a mild repetition penalty
- cap max output tokens
The three-step debug ladder:
- Is the chat template right?
- Is the memory budget honest?
- Is the GPU actually being used?
These three checks solve a surprising number of "Spark is slow" reports.
Optional deep cuts: newer serving layers worth watching #
You can skip this section on a first read. The core choices above are enough to start serving a model. These projects matter when you begin asking harder questions about clusters, persistent caches, and cross-hardware runtimes.
There is a lot happening outside the core tools above.
NVIDIA Dynamo #
NVIDIA Dynamo is an open-source distributed inference framework. It is not a replacement for vLLM, SGLang, or TensorRT-LLM. It coordinates them.
The important ideas are:
- route requests intelligently
- split prefill and decode across different workers
- move KV cache between memory tiers
- support distributed serving with backends like vLLM, SGLang, and TensorRT-LLM
On one Spark, this is probably not your Day 5 first move. For multi-Spark or larger production inference, Dynamo is worth watching closely.
LMCache: tested on this Spark, with a surprise ending #
LMCache is not an engine either. It is a KV cache layer that plugs into an engine, mainly vLLM, where it is integrated with upstream vLLM and used in vLLM and Dynamo production-style workflows.
The shortest possible explanation:
- vLLM can reuse a shared prompt while its own in-memory cache is alive
- LMCache tries to keep or share that expensive prompt work beyond one engine's memory
- on this single-Spark test, vLLM's own cache already handled the easy case
- the extra LMCache disk-persistence path wrote data successfully but could not find it after restart in the tested version pairing
So this is a useful real experiment, not a recommendation to add LMCache to every local setup.
Remember the mental model from earlier: prefill reads your prompt and builds the KV cache, and that work is expensive. Normally the cache lives in GPU memory and dies when it is evicted or the server restarts. LMCache treats that cache as something worth keeping. It can:
- save KV cache to disk or a remote store, so it survives restarts
- reuse cached work for repeated text anywhere in a prompt, not just shared prefixes (through its CacheBlend feature, which selectively recomputes tokens to recover quality)
- share cache between multiple serving instances
The classic pitch assumes a discrete GPU, where moving KV cache from GPU memory to CPU RAM frees precious VRAM. On a Spark that trick matters less, because the 128 GB is one unified pool. The parts that could matter here are disk persistence and cross-request reuse, for example a RAG setup where many requests carry the same large document.
Instead of leaving this as a map entry, I tested it on this Spark on 2026-07-15 and retested on 2026-07-16 after a vLLM upgrade, three version pairings in total. Here is what actually happened.
Getting it installed. LMCache publishes x86_64 manylinux wheels, but on ARM64/Spark I only had the source build path. Inside vllm/vllm-openai:v0.25.1, a plain pip install lmcache builds 0.5.1 from source cleanly, because the image ships nvcc and gcc. It was messier on the older vLLM 0.19.0 image: there, pip quietly backtracked to LMCache 0.4.2 to avoid downgrading the image's torch, and forcing 0.5.1 with --no-deps failed on a missing cusparse.h header until CPATH pointed at the headers inside torch's pip-installed CUDA packages. Across the two images, I built and tested LMCache 0.4.2 and 0.5.1.
Running it. Here is the exact path I used, so you can redo it on your own Spark. First bake LMCache into the vLLM image (the source build takes a few minutes):
docker run --name lmcache-build --entrypoint bash \
  -e TORCH_CUDA_ARCH_LIST=12.1 \
  vllm/vllm-openai:v0.25.1 \
  -c "pip install --no-cache-dir --no-build-isolation lmcache"

docker commit lmcache-build lmcache-vllm:spark
docker rm lmcache-buildThen write a small LMCache config, ~/lmcache-config.yaml. This enables the CPU and disk tiers:
chunk_size: 256
local_cpu: true
max_local_cpu_size: 20
local_disk: "file:///lmcache-disk/"
max_local_disk_size: 40And start vLLM with the connector attached:
mkdir -p ~/lmcache-disk

docker run -d --rm --name day5-lmcache --gpus all --ipc=host -p 8000:8000 \
  -v /home/saiyam/.cache/huggingface:/root/.cache/huggingface \
  -v /home/saiyam/lmcache-disk:/lmcache-disk \
  -v /home/saiyam/lmcache-config.yaml:/lmcache-config.yaml:ro \
  -e LMCACHE_CONFIG_FILE=/lmcache-config.yaml \
  --entrypoint python3 \
  lmcache-vllm:spark \
  -m vllm.entrypoints.openai.api_server \
  --model Qwen/Qwen2.5-3B-Instruct \
  --max-model-len 20480 \
  --gpu-memory-utilization 0.5 \
--kv-transfer-config '{"kv_connector":"LMCacheConnectorV1","kv_role":"kv_both"}'You know LMCache is live when the startup logs show Creating LMCacheEngine instance and each request logs a LMCache hit tokens: line.
How I measured TTFT. Time-to-first-token was measured on the box with a stdlib Python script that sends a streaming /v1/chat/completions request (an 11,342-token document plus a short question, max_tokens 64, temperature 0) and records the time until the first content chunk arrives. The restart test is docker restart day5-lmcache, wait for /v1/models to return 200, then repeat the same request. Cleanup afterward: docker stop day5-lmcache, and delete the ~/lmcache-disk directory if you want the stored chunks gone.
The measured numbers. This is not a general LMCache benchmark. This is one Spark, one model, and the in-process LMCacheConnectorV1 path. Same box, same model as my vLLM section: Qwen2.5-3B-Instruct BF16, one request at a time, an 11,342-token document plus a short question, TTFT measured on the box via the streaming API. These numbers are the current pairing, vLLM 0.25.1 with LMCache 0.5.1:
| Scenario | vLLM alone | vLLM + LMCache |
|---|---|---|
| First request after startup | 1.26 s | 1.31 to 1.36 s |
| Same document, new question | 0.072 s | 0.080 s |
| After a server restart | 1.24 s | 1.30 s |
| Decode speed | ~30 tok/s | ~30 tok/s |
Two readings jump out. First, prefill of 11.3k tokens on this box takes only about 1.3 seconds, roughly 9,000 tokens per second, so the absolute best a KV cache layer could save on this workload is about a second. Second, for the repeat-the-same-document case, vLLM's built-in prefix caching already answers in 0.07 seconds, and LMCache did not improve on that enough to matter. One genuine improvement over my first pass: on the older vLLM 0.19.0 pairing the connector cost roughly 10% of decode speed just by being on; on the current pairing that overhead was within noise.
The surprise: restart persistence did not work. The thing I expected this pairing to add on a single box is a KV cache that survives restarts. The store side works: my document became 44 chunk files, 396 MB on disk, with LMCache-reported store throughput of 11 to 27 GB/s. But after a restart, the logs said LMCache hit tokens: 0 and it re-prefilled everything. I chased down two separate causes:
- LMCache cannot import vLLM's chunk hash function, warns
Could not load 'builtin' from vLLM, and falls back to Python's built-in hash, which is randomized per process. Every restart names the same chunks differently. I confirmed it on the vLLM 0.19.0 pairing: the disk directory doubled from 44 to 88 chunks after one restart, same tokens under new names. - Pinning
PYTHONHASHSEED=0makes the names deterministic, but lookups still return zero hits. The local-disk index lives only in memory and is never rebuilt from the files at startup.
I then retested on the current pairing, vLLM 0.25.1 with LMCache 0.5.1. The Could not load 'builtin' warning still appears, and the restart lookup still returns LMCache hit tokens: 0.
So in all three pairings I tested (LMCache 0.4.2 and 0.5.1 on vLLM 0.19.0, and LMCache 0.5.1 on vLLM 0.25.1), the local-disk tier behaved like a write-only tier across restarts. The KV files land on disk and are never found again.
One more scoping note: LMCache's current documentation now labels this in-process connector approach "Legacy (In-Process Mode)" and is moving toward a separate multiprocess server architecture. So read this as a verdict on the in-process pairings I tested, not on LMCache as a whole.
What fits and what does not. For this single-Spark workload and these legacy in-process pairings, LMCache did not earn its keep: the in-process win is already covered by vLLM's native prefix caching, and cross-restart reuse failed in all three pairings I tested. Current LMCache guidance points toward its multiprocess server mode instead, which I have not tested. Where it should shine is the setting it was actually built for: multiple serving instances sharing a cache tier, matched-version stacks like the project's own containers, and clusters where prefill is genuinely expensive. On a 3B model with a roughly 9,000 tok/s prefill rate, there is simply not much time to save. Recheck this when the ARM64 packaging and the vLLM pairing settle down, because the idea is right even though these pairings are not there yet.
MAX by Modular #
MAX is Modular's high-performance inference framework. The interesting idea is a compiler/runtime stack that targets different hardware through the Modular ecosystem.
This is not a tested Spark path in this series. It belongs on the wider landscape for readers comparing vLLM, SGLang, TensorRT-LLM, and cross-hardware runtimes.
ZML/LLMD alpha #
ZML/LLMD is a newer alpha inference server from the ZML team. Its pitch is ambitious: one self-contained LLM server across NVIDIA CUDA, AMD ROCm, Google TPU, Intel oneAPI, and Apple Metal.
The interesting parts are the serving features it is trying to make cross-platform: continuous batching, paged attention, tensor parallel sharding, prefix caching, tool calling, Prometheus metrics, and DFlash speculative decoding for supported models.
That belongs in this post because it attacks the same problem from a compiler-first, cross-hardware direction. After seeing the launch post, I did a quick Spark smoke test rather than just mentioning it.
On this Spark, the CUDA image had an arm64 manifest, pulled successfully, detected the GB10, loaded CUDA compatibility libraries, and served Qwen/Qwen3-0.6B through the OpenAI-compatible API:
docker run -d --rm --name day5-zml-llmd \
  --gpus all \
  --shm-size=32GB \
  -p 127.0.0.1:8011:8000 \
  zmlai/llmd:cuda \
  --model=hf://Qwen/Qwen3-0.6B \
  --model-name=qwen3-0.6b \
  --max-context-len=4096 \
  --batch-size=1 \
--gpu-memory-fraction=0.40The useful startup lines were:
info(llmd): Devices:
info(llmd):     - NVIDIA GB10 (cuda:0)
info(llama): Allocating 26238 pages for the KvCache: 44.840GiB
info(llama): Compiled all models [18.796s]
info(llama): Loaded weights [1.40GiB, 46.282s, 30.98MiB/s]
info(llmd): Loaded a model of type qwen3
info(llmd): Listening on 0.0.0.0:8000/v1/models returned the local model:
{"id":"qwen3-0.6b","object":"model","owned_by":"local"}And a tiny /v1/chat/completions request returned successfully:
elapsed_s 0.346
prompt_tokens: 28
completion_tokens: 49
total_tokens: 77The /metrics endpoint also worked and exposed Prometheus-style counters for /v1/models and /v1/chat/completions.
Do not read that as a performance benchmark. It is a tiny Qwen3 0.6B compatibility smoke test, not a tuned Spark serving result. The important point is narrower and still useful: ZML/LLMD alpha does run on the Spark's ARM64 + GB10 CUDA path, at least for a small model. DFlash, larger Gemma/Qwen models, tensor parallelism, and real throughput numbers still need a separate proper test.
EXO #
EXO is about local distributed inference across Macs and workstations. The project describes a local cluster that finds devices, reads the network topology, splits model work across memory, and serves normal APIs.
This is not the same problem as "which engine should I run on one Spark?" But it matters for the future of deskside AI: multiple local machines acting like one inference pool.
MLX and mlxcel #
MLX is Apple's machine-learning framework for Apple Silicon. mlxcel is a newer Rust-native MLX inference engine that I tested on an M1 Max in a separate post: mlxcel: A Rust-Native Inference Engine for Apple Silicon.
This is not a DGX Spark runtime. It is an Apple Silicon runtime.
But it is useful for the mental model because it shows the same story on different hardware:
hardware memory model plus runtime design decides real-world local LLM performance.
Spark has GB10, CUDA, Blackwell, and unified memory. Apple Silicon has MLX, Metal, and unified memory. The lesson is shared even if the code paths are different.
Wandler and WebGPU-style local servers #
Wandler is another related local-inference direction: TypeScript, Transformers.js, ONNX, WebGPU, and OpenAI-compatible local serving. I tested it separately too: Wandler: Local OpenAI-Compatible Inference With Transformers.js and WebGPU.
Again, not a Spark-first choice. But it belongs in the "the ecosystem is moving fast" paragraph because local inference is no longer only Python or CUDA.
What's coming next #
Next we look at the models: which ones actually fit this box, which are worth running for which workload, and how to read benchmark numbers without fooling yourself.
References and sources:
- Ollama: NVIDIA DGX Spark performance
- llama.cpp speculative decoding docs
- llama.cpp PR #22105: DFlash speculative decoding support
- vLLM documentation
- vLLM on the DGX Spark
- vLLM for Inference on DGX Spark
- Docker Model Runner docs
- Docker Model Runner inference engines
- SGLang on DGX Spark
- LM Studio on DGX Spark
- TensorRT-LLM on DGX Spark
- NIM on DGX Spark
- NIM model profiles and selection
- Hermes Agent with local models on DGX Spark
- NemoClaw with a local LLM on DGX Spark
- OpenClaw on DGX Spark
- NVIDIA Dynamo
- TensorRT-LLM overview
- MAX by Modular
- ZML/LLMD alpha
- zml/zml on GitHub
- EXO
- mlxcel on M1 Max
- Wandler local WebGPU inference
Saiyam is working as Head of DevRel at vCluster Labs. He is the founder of Kubesimplify, focusing on simplifying cloud-native & AI infrastructure. He is KubeCon Co-chair and has worked on many facets of Kubernetes, including machine learning platforms, scaling, multi-cloud, & managed Kubernetes services. When not coding, Saiyam contributes to the community by writing blogs and organizing local meetups for Kubernetes and CNCF. He is also a CNCF TAG OpsRes Chair & can be reached on Twitter @saiyampathak.
Get new posts in your inbox.
Spotted a typo or want to improve this post? Edit on GitHub →
Discussion
Related posts
local-ai
The Local LLM Glossary: Every Term, Flag, and Number in Plain English
19 min read
nvidia
Day 4: Quantization Demystified. BF16, FP8, NVFP4, MXFP4, INT4, GGUF, and Why It All Matters
28 min read
nvidia
Day 3: The DGX Spark Unpacked. GB10, Unified Memory, sm_121, and the One Reason This Hardware Exists
19 min read