What Actually Happens When kube-scheduler Picks a Node (13 Stages Inside Kubernetes)
How kube-scheduler picks a node: 13 framework stages, 14 Filter plugins, 9 Score plugins, live preemption demo.

On this page (17)
- TL;DR, the 13 stages
- The scheduling framework
- Three queues, before any plugin runs
- Stage 1: PreEnqueue (the gate)
- Stage 2: QueueSort (the order)
- Stage 3: PreFilter (cache once)
- Stage 4: Filter (every node, every plugin, in parallel)
- Stage 5: PostFilter (preemption, the expensive escape hatch)
- Stage 6: PreScore (cache once again)
- Stage 7: Score (the leaderboard, weighted)
- Stage 8: NormalizeScore and picking a winner
- Stage 9: Reserve (claim the resources in memory, before the API knows)
- Stage 10: Permit (the gang-scheduling hook)
- Stages 11, 12, 13: PreBind, Bind, PostBind (commit and clean up)
- The live demo, preemption in action
- Three takeaways
- Where to go from here
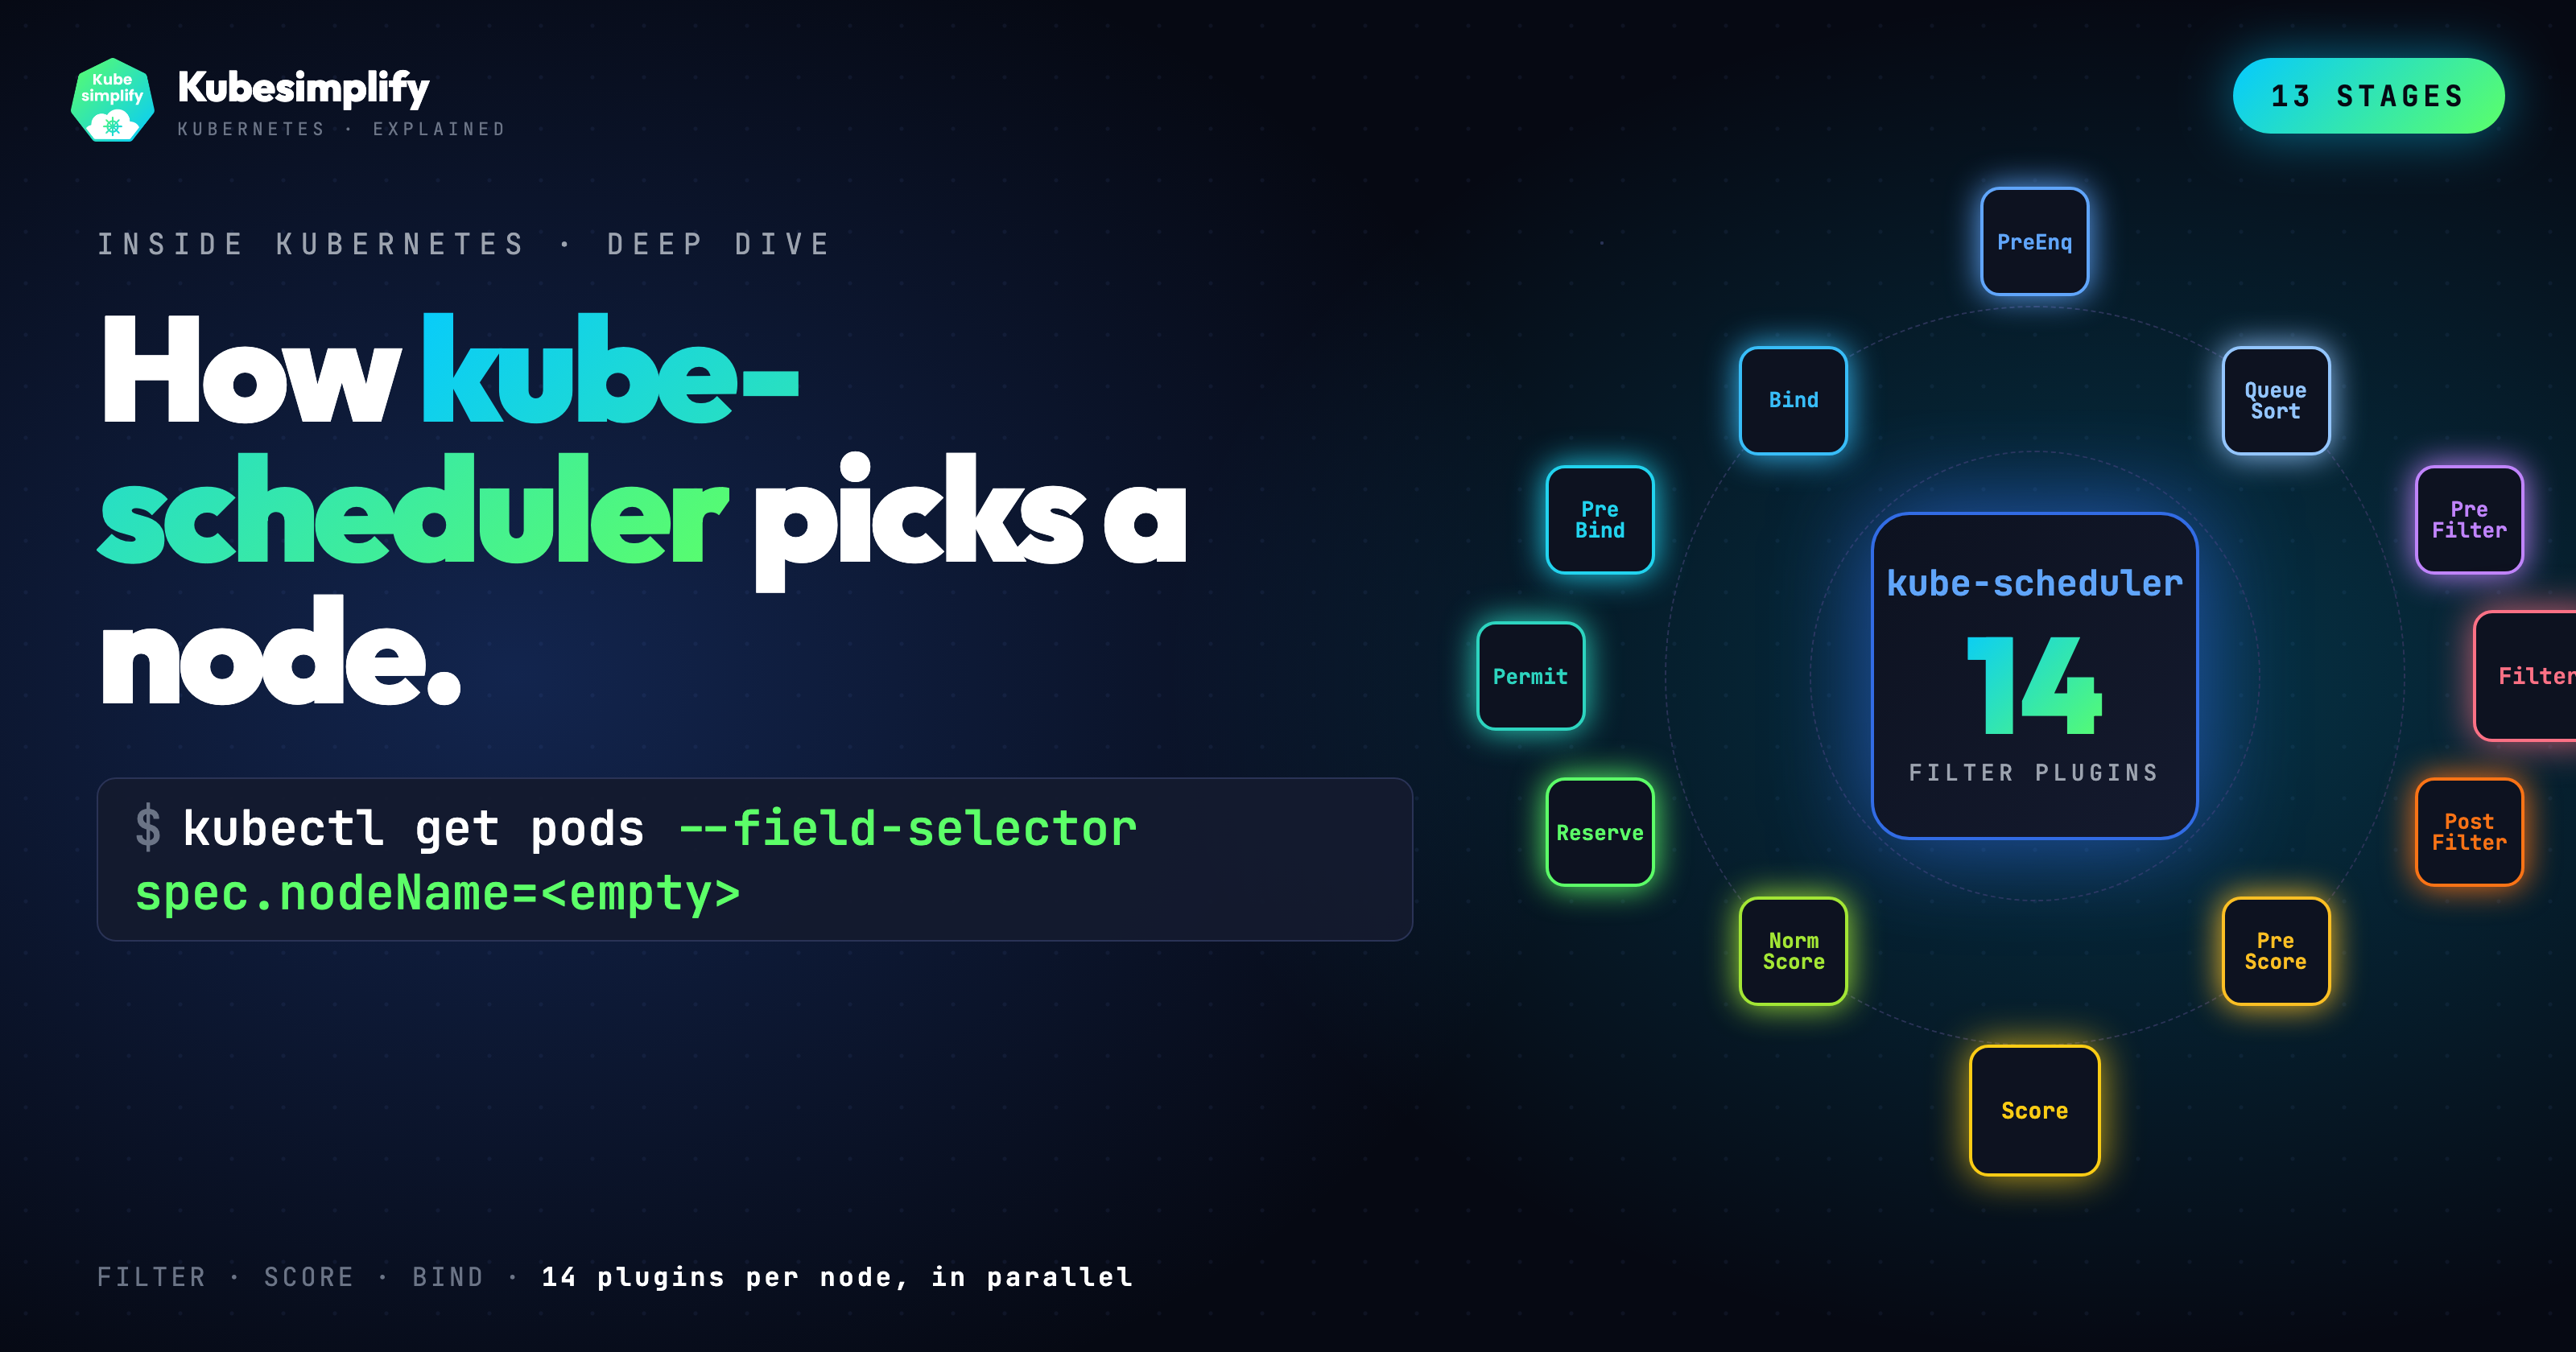
Your pod has just been written to etcd. The API server returned 201 Created. The pod exists. But spec.nodeName is still empty, and that is the entire reason this post exists.
A pod with no node is not a real workload. It is a row in a database. Something has to look at it, decide which machine should run it, and atomically claim that machine. That something is kube-scheduler, and the way it makes the decision is more interesting than "pick the node with the most free CPU."
There are thirteen separate stages in modern scheduling. The Filter stage alone runs fourteen in-tree plugins, each one capable of disqualifying a candidate node with a single Unschedulable verdict. There is no appeal, no second chance, no "best effort." Either every plugin says yes, or that node is out.
This post walks every stage end-to-end against the v1.36 source code, with verbatim outputs from a real cluster at the bottom.
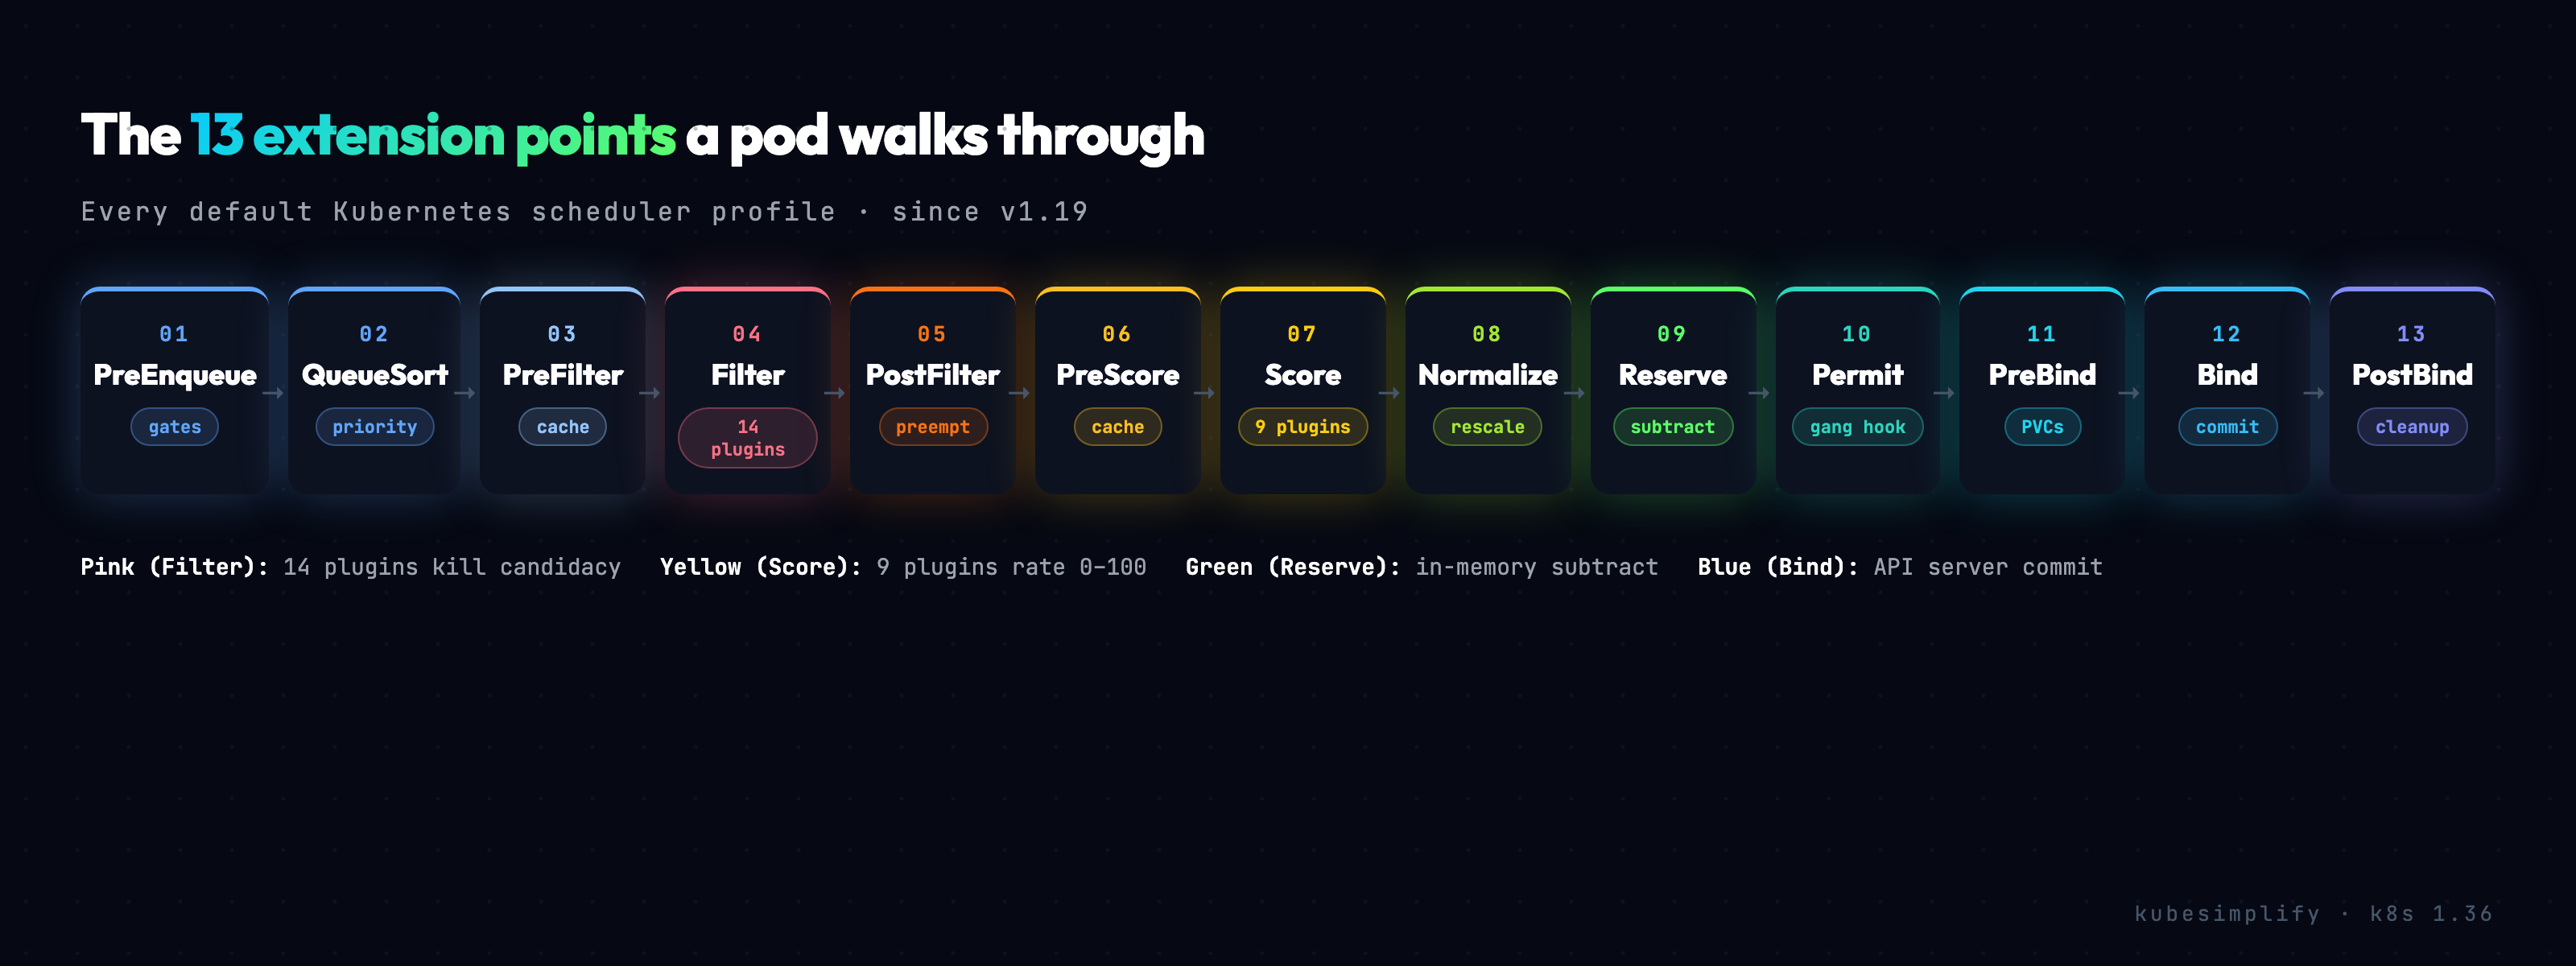
TL;DR, the 13 stages #
-
PreEnqueue. Gating plugins decide if the pod is even allowed into the queue. SchedulingGates lives here. If a gate is set, the pod waits.
-
QueueSort. The activeQ orders pods by priority. Higher priority first.
-
PreFilter. Eleven plugins precompute what the pod actually wants. Resources, affinity terms, topology spread, all stashed in CycleState. Compute once, read many times.
-
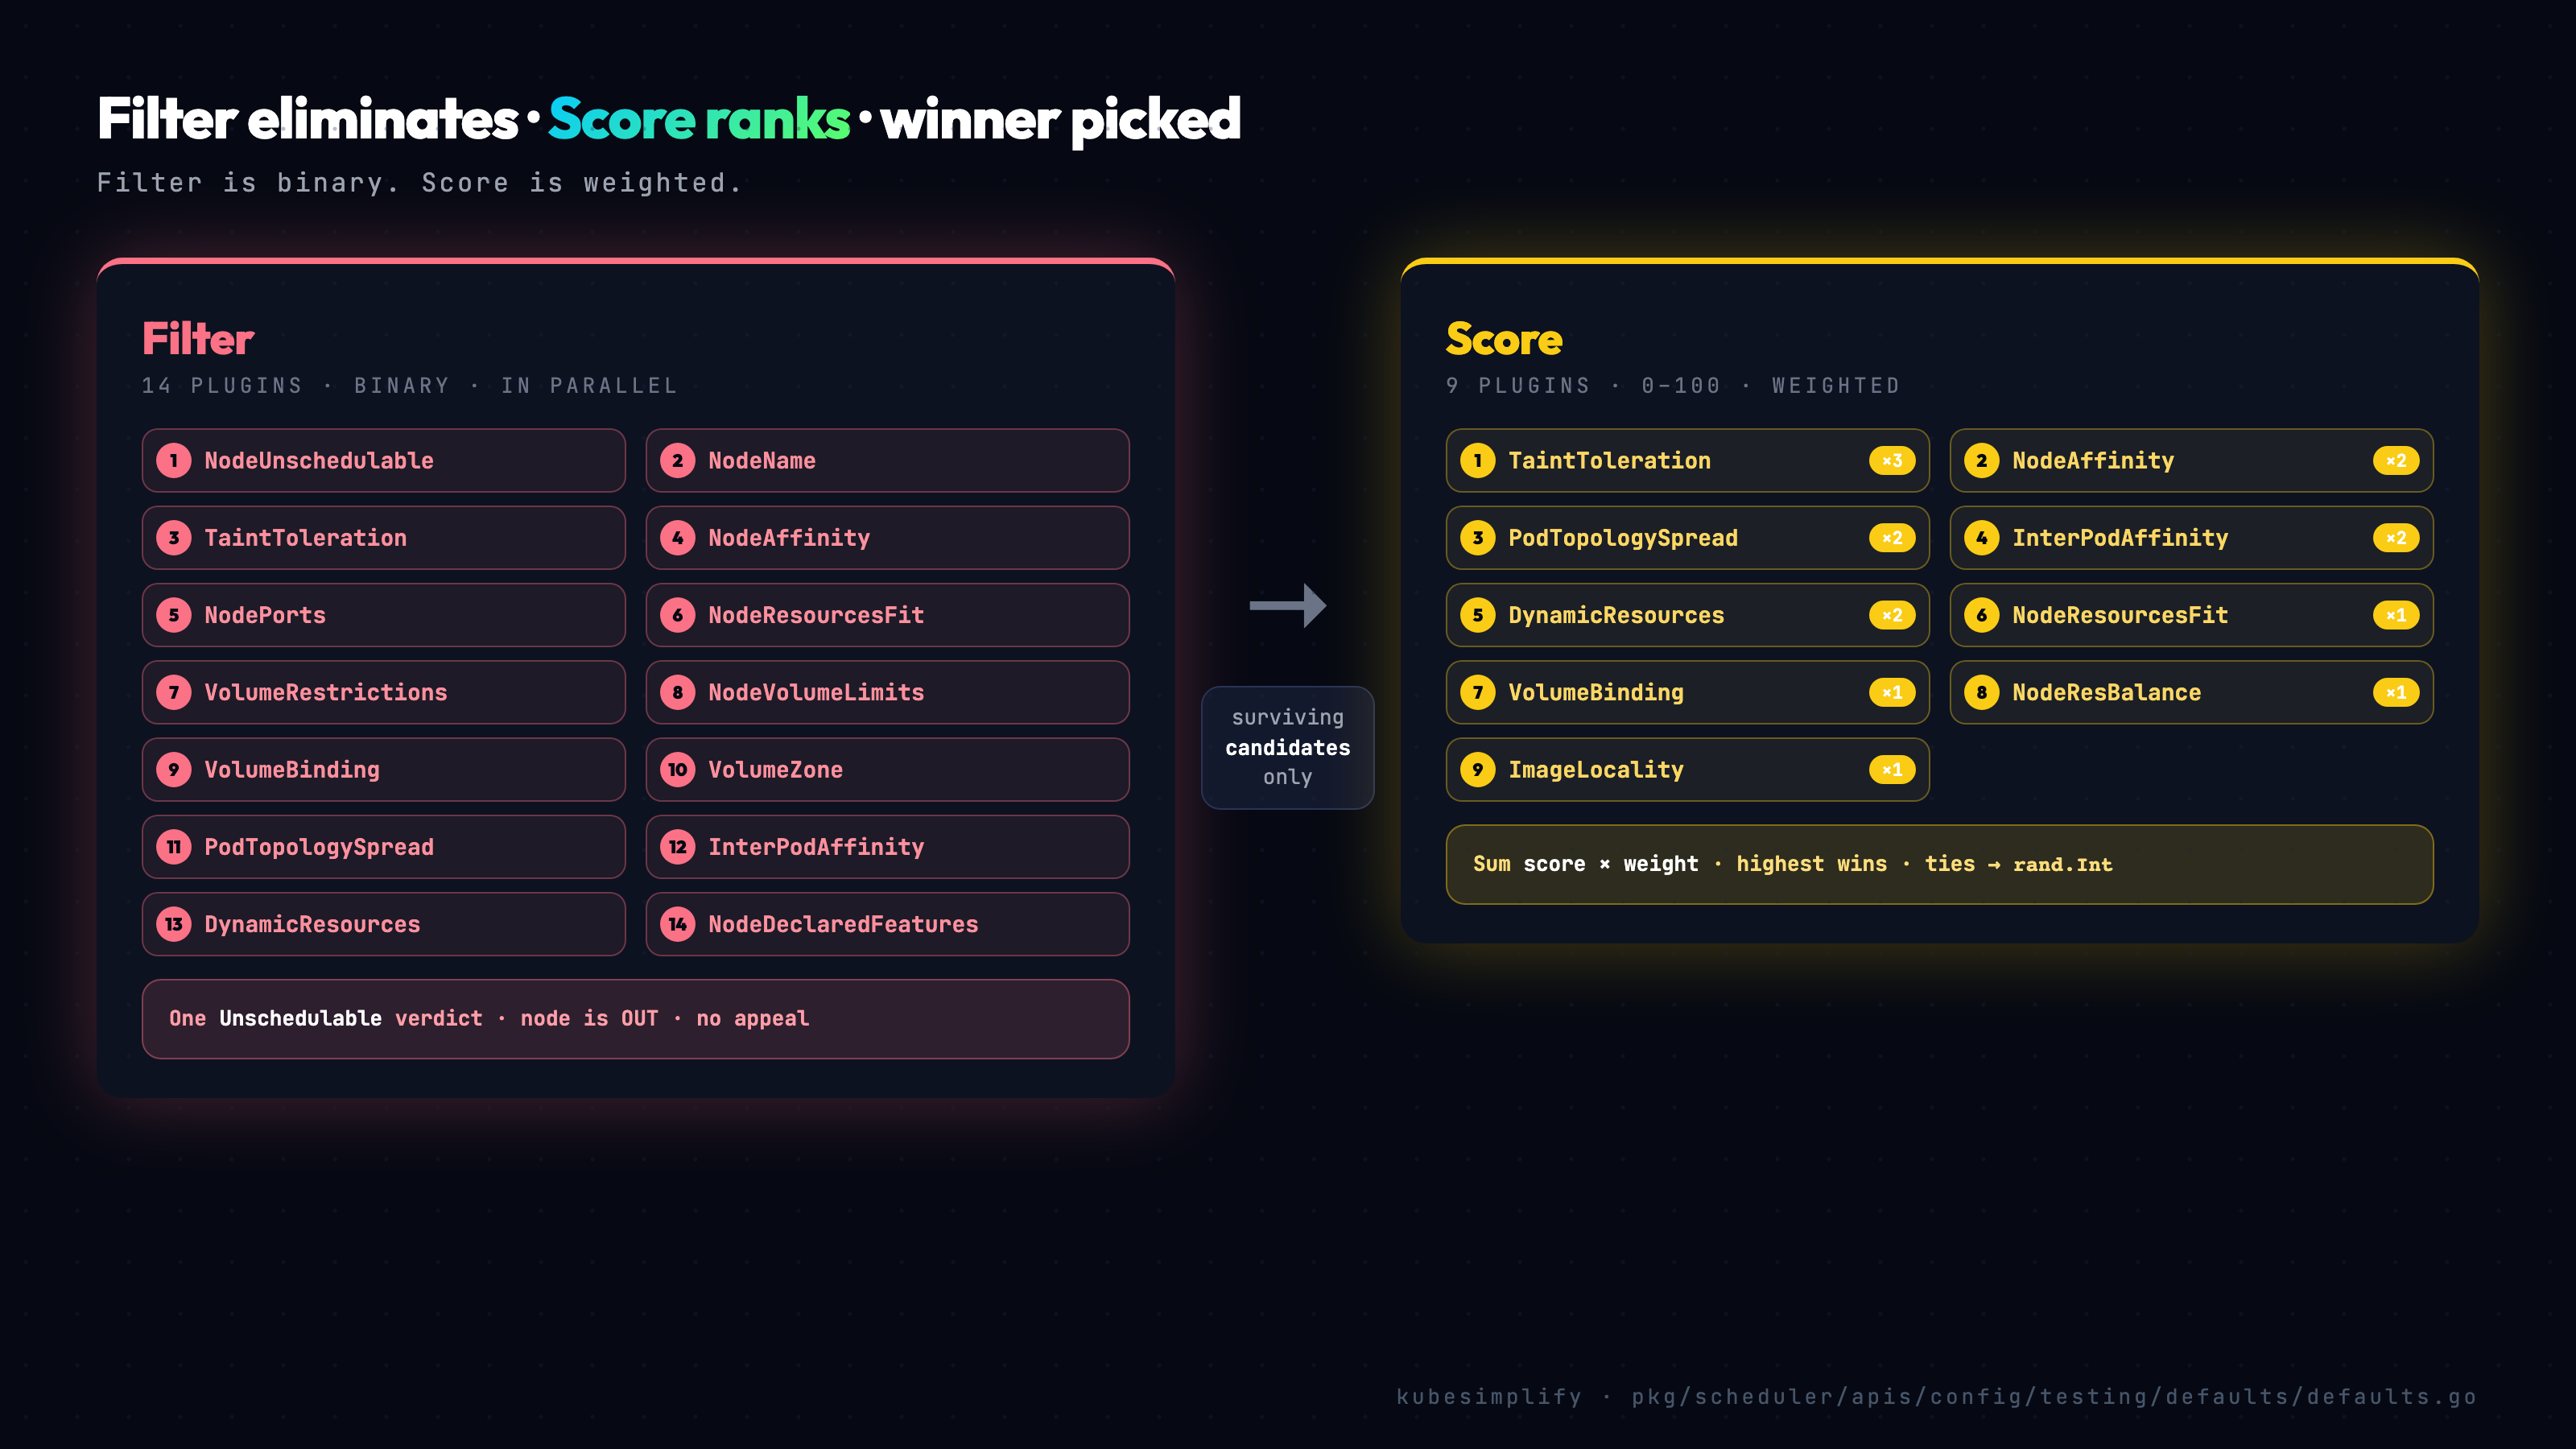
Filter. Fourteen plugins each test every node in parallel. NodeUnschedulable, NodeName, TaintToleration, NodeAffinity, NodePorts, NodeResourcesFit, VolumeRestrictions, NodeVolumeLimits, VolumeBinding, VolumeZone, PodTopologySpread, InterPodAffinity, DynamicResources, NodeDeclaredFeatures. One Unschedulable verdict and the node is out.
-
PostFilter. Only fires if every node failed Filter. DefaultPreemption asks, "if I evicted some lower priority pods, could this one fit?" If yes, it picks victims and the pod retries next cycle.
-
PreScore. Same trick as PreFilter. Plugins that do heavy per node work during scoring precompute once and cache.
-
Score. Nine plugins rate every surviving node, zero to one hundred. In parallel. Each plugin has a weight. TaintToleration is three. NodeAffinity, InterPodAffinity, PodTopologySpread, DynamicResources are all two. Rest are one.
-
NormalizeScore. Rescales every plugin's output. Then for each node, multiply scores by weights, add it all up. Highest sum wins. Ties? Go's
rand.Int. Yes, random. Deterministic ties would hot spot the same node every time. -
Reserve. The scheduler subtracts the pod's requests from the winning node's in memory snapshot. So the next pod in the same cycle sees that node as already loaded.
-
Permit. A hook. A plugin can Approve, Wait, or Reject. Stock cluster, no op. But Kueue, Volcano, Coscheduling all wait here for gang scheduling.
-
PreBind. Last chance to do work before the API server gets told. VolumeBinding finalizes PVC binds here.
-
Bind. The DefaultBinder updates spec dot node name on the pod via the API server. Now etcd has the assignment.
-
PostBind. Cleanup. The pod is gone from the scheduler's queue.
That is the whole walkthrough. The rest of this post is the part that does not fit in a tweet.
The scheduling framework #
Since Kubernetes 1.19, kube-scheduler has been built on top of the scheduling framework (KEP-624, beta in 1.18, GA in 1.19). The core of the binary is small and intentionally dumb. All of the actual decision-making lives in plugins, registered at well-defined extension points.
This separation is what makes the rest of the ecosystem possible. You can disable plugins. You can write your own as a Go module or behind a webhook. You can run multiple scheduler profiles side by side and let pods pick one with spec.schedulerName. Most installations never touch the configuration, but if you have ever wondered how Volcano, Kueue, or Coscheduling plug into the scheduler without forking it, this is the answer: they register against the framework's extension points and the core just calls them at the right time.
The thirteen extension points are not arbitrary. Each one corresponds to a moment in the pod's lifecycle where it makes sense to ask plugins a question. Should this pod even enter the queue? That is PreEnqueue. Is this node a candidate? That is Filter. Among the candidates, which one is the best fit? That is Score. The framework gives you the seam; the plugin fills in the logic.
Three queues, before any plugin runs #
Before any plugin gets called, the pod has to make it into the right queue. The scheduler maintains three of them, and they each serve a different purpose.
The activeQ is a priority heap. Unscheduled pods are ordered by spec.priority, and the scheduler always pops from the head. Higher-priority pods cut in line, which is exactly what you want for things like critical control-plane pods or paid-tier workloads.
The backoffQ holds pods that just failed a scheduling attempt. They sit there for a small (and exponentially growing) timeout before being promoted back into the activeQ. This is not laziness; it is a correctness property. If a pod could not be scheduled in this cycle, retrying it immediately almost always fails the same way. Backoff lets the cluster state change first.
The unschedulableQ (the source actually calls it unschedulablePods, but the docs and the metrics use the queue suffix) is an indexed map of pods that have been declared unschedulable for now. These pods do not retry on a timer. They retry on events. If a new node is added, an informer event fires MoveAllToActiveOrBackoffQueue and they all get a fresh shot. Same thing if a pod is deleted and frees up resources. There is also a five-minute fallback timer for pods that have been waiting too long, in case the event stream missed an update.
All three queues live in pkg/scheduler/backend/queue/scheduling_queue.go. Their names are also exposed as labels on the scheduler_pending_pods metric, which is the easiest way to debug a stuck cluster: a queue full of pods in Unschedulable is telling you something different than a queue full of pods in Backoff.
Stage 1: PreEnqueue (the gate) #
PreEnqueue plugins decide whether a pod is even allowed into the activeQ. If any plugin returns Unschedulable, the pod sits in the unschedulableQ until something causes its gate to clear.
The canonical example is the SchedulingGates plugin. By setting spec.schedulingGates on a pod, you can create the pod object now but defer its scheduling until you explicitly remove the gate. This pattern shows up in batch workloads, in cost-aware scheduling controllers, and in anything that wants to express "this pod exists but isn't ready to run yet."
Most pods sail through PreEnqueue with no gates set, but it is the very first checkpoint and worth knowing about.
Stage 2: QueueSort (the order) #
Pods waiting in the activeQ have to be ordered somehow. QueueSort plugins define that order. The default is PrioritySort: it ranks pods by spec.priority (an integer) descending, and falls back to creation timestamp for ties. Older pod with the same priority wins.
There is one plugin, it does one thing, and you almost never want to change it. Worth a sentence in the model, not much more.
Stage 3: PreFilter (cache once) #
Once a pod is popped off the activeQ, the scheduler's first real job is to look at what the pod actually wants. That is PreFilter, and it runs exactly once per pod per cycle.
The default profile registers eleven PreFilter plugins, each one extracting a different facet of the pod's requirements: NodeResourcesFit pulls out CPU, memory, and extended-resource requests; NodeAffinity normalizes the affinity term tree; PodTopologySpread builds its per-topology-key constraint sets; InterPodAffinity walks the affinity and anti-affinity rules; VolumeBinding figures out which PVCs still need binding; and so on.
All of this work is cached in a framework.CycleState object. Think of CycleState as a per-pod scratch pad. compute the expensive things once, read them many times. The reason it matters becomes obvious in the next stage, where each plugin is about to be called several thousand times in tight loops.
Stage 4: Filter (every node, every plugin, in parallel) #
Filter is where the bulk of the scheduling work actually happens. Fourteen plugins are called against every candidate node, in parallel, and any single Unschedulable verdict eliminates that node from the rest of the cycle.
Here is the verified list, straight from pkg/scheduler/apis/config/testing/defaults/defaults.go:
-
NodeUnschedulable -
NodeName -
TaintToleration -
NodeAffinity -
NodePorts -
NodeResourcesFit -
VolumeRestrictions -
NodeVolumeLimits -
VolumeBinding -
VolumeZone -
PodTopologySpread -
InterPodAffinity -
DynamicResources(went GA in 1.36) -
NodeDeclaredFeatures
Each plugin receives the pod, the candidate node's info, and the CycleState that PreFilter built up. Each plugin returns Success or Unschedulable. If any of them says Unschedulable, that node is gone. There is no aggregation, no scoring at this stage, no "well, three out of four said yes." It is binary, and that is what makes Filter fast: the scheduler can fan out to all 14 plugins in parallel, and short-circuit on the first failure per node.
Most engineers will only ever care about a handful of these by name. A quick tour:
NodeUnschedulable is the first line of defense. If the node has spec.unschedulable: true, this plugin filters it out. That is exactly what kubectl cordon does.
NodeName is the simplest possible filter. If the pod has spec.nodeName set (you can set it manually and skip the scheduler entirely), only that node passes; the scheduler effectively becomes a no-op.
TaintToleration is the one most engineers will recognize. The node has taints, the pod has tolerations, and any unmatched NoSchedule or NoExecute taint kills candidacy. The "GPU node" pattern in the demo at the bottom of this post is just a NoSchedule taint that nothing tolerates.
NodeAffinity evaluates the pod's spec.affinity.nodeAffinity rules. Required affinity terms must match here at Filter; preferred terms get scored later.
NodeResourcesFit is the one most people intuitively understand. Does the node have enough free CPU, memory, and any other Kubernetes resource (hugepages, GPUs, custom resources) to fit the pod's requests? Notably, only requests are considered, not limits, which is why a node can be massively over-subscribed on limits and the scheduler still happily places more pods.
VolumeBinding deserves a paragraph of its own. If the pod has PVCs that are not yet bound, VolumeBinding has to decide whether each unbound PVC could be bound on this specific node. For a WaitForFirstConsumer storage class the answer depends on zone, on the storage backend's topology, and on which PVs exist. VolumeBinding doesn't just filter; it also remembers the provisioning plan it chose, and that plan gets locked in during the Reserve stage further down.
DynamicResources is the new kid on the block. It implements the DRA framework, which went GA in 1.36. If your pod uses ResourceClaims (the modern way to ask for GPUs and other devices), DynamicResources is the plugin that figures out whether a node can satisfy the claim.
NodeDeclaredFeatures is newer still. It compares features the node has declared against the pod's required features, and is feature-gated in some configurations.
Run all 14 plugins in parallel against every node, collect the verdicts, and whatever survives all 14 votes moves on. If nothing survives, the scheduler doesn't give up: it runs PostFilter.
Stage 5: PostFilter (preemption, the expensive escape hatch) #
If every node failed Filter, the scheduler is in trouble. The pod is unschedulable on the cluster as it stands today. PostFilter exists for exactly this case, and the default plugin is DefaultPreemption. It asks a single question: if I evicted some lower-priority pods, could this one fit?
The algorithm sounds simple but is genuinely expensive. For each node, the scheduler:
-
Gathers all pods on the node with priority lower than the pending pod.
-
Simulates evicting them one at a time, lowest priority first.
-
After each simulated eviction, re-runs Filter on the hypothetical state.
-
If the pod becomes schedulable, the node is a candidate, and the minimum set of pods that need to die is recorded.
After all candidate nodes have been evaluated, the scheduler picks the "best" one. fewest victims, lowest victim priority, latest creation time as a tiebreaker. The exact ordering lives in pkg/scheduler/framework/plugins/defaultpreemption/default_preemption.go.
Once a candidate is picked, two things happen. The scheduler sets nominatedNodeName on the pending pod, so anyone watching the API can see this pod is targeting a specific node. Then it gracefully deletes the victims through the API server, respecting their terminationGracePeriodSeconds. The pending pod itself goes back into the activeQ to be retried in the next cycle.
This whole process is expensive. The first Filter sweep already touched every node. Now the scheduler is running Filter again, multiple times, against simulated state per candidate. Tens to hundreds of milliseconds easily, seconds on large clusters. The good news is that the vast majority of pods never hit this path; they schedule cleanly on the first try.
PostFilter has a second plugin now: DynamicResources. Same idea, but for ResourceClaims rather than pods. If a Filter cycle failed because of a claim that is busy, DynamicResources' PostFilter can deallocate idle claims to make room.
Stage 6: PreScore (cache once again) #
Filter has done its work. Maybe four nodes are left, maybe forty. Either way, it is time to score them, and the scheduler reuses the same precompute trick from PreFilter.
Some Score plugins do expensive per-node work. To avoid recomputing the same input data once per node, those plugins do their work once in PreScore and stash the result in CycleState. The default PreScore plugins are TaintToleration, NodeAffinity, NodeResourcesFit, VolumeBinding, PodTopologySpread, InterPodAffinity, and NodeResourcesBalancedAllocation.
InterPodAffinity is the heaviest of the bunch. It walks the cluster's existing pods, builds a topology map of where each pod sits, and converts the new pod's affinity rules into an indexed structure. PodTopologySpread does similar work, building per-topology-key counts.
After PreScore, each individual Score call becomes effectively O(1). a lookup against precomputed state. Without it, scoring large clusters would be unworkable.
Stage 7: Score (the leaderboard, weighted) #
Now the actual ranking. Every Score plugin rates every surviving node from 0 to 100, in parallel.
The default Score plugins, with weights:
-
TaintToleration, weight 3 -
NodeAffinity, weight 2 -
NodeResourcesFit, weight 1 -
VolumeBinding, weight 1 -
PodTopologySpread, weight 2 -
InterPodAffinity, weight 2 -
DynamicResources, weight 2 -
NodeResourcesBalancedAllocation, weight 1 -
ImageLocality, weight 1
That is nine plugins. All verified against defaults.go.
The weights are not arbitrary. The source comments explain the reasoning: TaintToleration is tripled because user-expressed taint preference is a strong signal. NodeAffinity, PodTopologySpread, InterPodAffinity, and DynamicResources are doubled because they encode user intent. The rest are weight 1 because they are infrastructure-level signals (balance, cache hits) that should influence the decision but not dominate it.
It is worth zooming in on ImageLocality for a moment. Once you understand it, you start noticing its effect everywhere.
ImageLocality asks one question per node: do you already have the container image's layers cached? If yes, score 100. If no, score 0. That is the entire plugin.
It matters because on a cold node, the kubelet has to pull the image over the network. seconds for a small image, tens of seconds for a fat ML or LLM image. On a warm node, the pod starts in milliseconds. ImageLocality is a soft preference (it doesn't filter), but it nudges the scheduler toward already-warm nodes when other things are equal, and the cumulative effect on workload startup latency is huge.
NodeResourcesFit is the resource-balance plugin you've probably tuned at some point. By default it uses LeastAllocated, which prefers nodes with more free capacity (spreading the load). You can flip it to MostAllocated for bin-packing, or to RequestedToCapacityRatio for custom curves, via KubeSchedulerConfiguration.
NodeResourcesBalancedAllocation is subtler. It rewards nodes whose CPU and memory utilization are balanced. A node at 80% CPU and 20% memory scores worse than a node at 50%/50%, because imbalanced nodes are more likely to fragment future scheduling decisions.
Stage 8: NormalizeScore and picking a winner #
All nine plugins have scored every surviving node. The scheduler now picks the winner.
NormalizeScore rescales every plugin's output to a uniform 0 to 100 range. Some plugins return raw counts or other custom scales; this stage brings everything to the same units.
For each node, the scheduler then sums score × weight across all nine plugins. Highest sum wins.
The interesting question is what happens when two nodes have exactly the same total. The scheduler picks one at random. specifically, it uses Go's math/big.Int random (rand.Int), not rand.Intn. The choice matters more than it might seem.
Random tie-breaking exists to prevent hot-spotting. Imagine two equally suitable nodes for a workload. If the scheduler always picked the first one in some deterministic order, every pod from that workload would pile onto the same node and the other one would sit empty. Randomization spreads the load.
The choice of rand.Int over rand.Intn matters because rand.Intn has a subtle modulo bias for non-power-of-two ranges. Over millions of scheduling decisions across a large cluster, that bias becomes a real distribution skew. rand.Int avoids it.
Stage 9: Reserve (claim the resources in memory, before the API knows) #
The winner is picked, but at this point the API server still does not know about the decision. As far as etcd is concerned, the pod is still unscheduled.
Reserve fixes that locally. The scheduler takes the winning node's in-memory snapshot and subtracts whatever the pod requested: CPU, memory, extended resources, PVCs that need binding.
A critical detail: the scheduler operates on requests, not limits. And if your pod has no requests at all, the scheduler does not invent defaults. that is LimitRanger's job, much earlier at admission time. Here, Reserve subtracts whatever requests the pod has, even if it is zero. The scheduler's view of node capacity is purely request-based; a node could be massively over-subscribed on limits and the scheduler would never know or care.
The reason Reserve happens in memory before the bind is so the next pod in the same scheduling cycle sees this node as already loaded. Picture scaling a deployment to twenty replicas all at once: without Reserve, the scheduler's cache would still show the same node as fully free for every pod, and they would all pile onto it. Reserve makes the cache reflect the scheduler's intent immediately, even before etcd has acknowledged anything.
If anything fails after Reserve, Unreserve rolls it back. The in-memory subtraction is undone and the node looks free again.
Stage 10: Permit (the gang-scheduling hook) #
Permit is a hook with three possible outcomes per plugin. Approve lets the bind proceed (the default). Wait parks the pod, waiting for an external signal. Reject fails scheduling outright.
A stock cluster has no Permit plugins registered, so most pods sail through. But Permit is the seam where gang scheduling lives. Kueue, Volcano, and Coscheduling all register Permit plugins, and the pattern is the same: when the first pod of a gang arrives, return Wait and park it. When the last pod of the gang arrives, signal all the parked pods to proceed. They all bind together, atomically.
Without Permit, gang scheduling on Kubernetes would be effectively impossible. You would have to bind each pod individually and then evict the rest when one failed. Permit lets you wait at the right point. before any pod is bound. so failures cost nothing.
Stages 11, 12, 13: PreBind, Bind, PostBind (commit and clean up) #
Permit returned Approve. Three stages left, all of them short.
PreBind is the last opportunity to do work before the API server is told. The biggest user is VolumeBinding: for dynamically provisioned PVCs, this is where the PV is actually created and the PVC's spec.volumeName is set. By the time Bind runs, the PVC is bound and ready.
Bind does the actual API call. The default is DefaultBinder, which calls pods.Bind() on the API server. a special endpoint that updates spec.nodeName and creates a Binding object. etcd persists it via Raft, followers fsync, and the pod is now officially assigned.
The kubelet on the chosen node has been watching the API server for pods with its own nodeName. The instant the bind lands, the kubelet's informer fires. The pod is no longer the scheduler's concern; it now belongs to a different deep-dive (image pull, runc, the five syscalls).
PostBind is cleanup. The scheduler removes the pod from its internal queue, and that scheduling cycle is done.
The live demo, preemption in action #
Theory only carries so far. To watch the scheduler actually preempt a pod, we ran this against a real cluster (Kubernetes 1.36.1, three workers, one tainted). What follows are verbatim outputs from the live recording.
The setup: three worker nodes, with kube-worker-3 tainted as a fake GPU node so the scheduler refuses to put general workloads there.
$ kubectl get nodes
NAME            STATUS   ROLES           AGE   VERSION
kube-cp-01      Ready    control-plane   41d   v1.36.1
kube-worker-1   Ready    <none>          41d   v1.36.1
kube-worker-2   Ready    <none>          41d   v1.36.1
kube-worker-3   Ready    <none>          12d   v1.36.1
$ kubectl describe node kube-worker-3 | grep -E 'Taints|cpu:|memory:'
Taints: workload=gpu:NoSchedule
cpu: 8
memory: 32852Mi
cpu: 7800m
memory: 30100MiWe deploy a regular nginx pod requesting eight CPU. It schedules cleanly onto kube-worker-1 and starts up.
$ kubectl apply -f nginx-pod.yaml
pod/nginx-demo created

$ kubectl get events --sort-by=.lastTimestamp | tail -5
LAST SEEN   TYPE     REASON      OBJECT           MESSAGE
6s          Normal   Scheduled   pod/nginx-demo   Successfully assigned default/nginx-demo to kube-worker-1
5s          Normal   Pulling     pod/nginx-demo   Pulling image "nginx:1.27"
3s          Normal   Pulled      pod/nginx-demo   Successfully pulled image "nginx:1.27" in 1.812s
2s          Normal   Created     pod/nginx-demo   Created container: nginx
2s          Normal   Started     pod/nginx-demo   Started container nginx
$ kubectl get pod nginx-demo -o wide
NAME READY STATUS RESTARTS AGE IP NODE NOMINATED NODE READINESS GATES
nginx-demo 1/1 Running 0 18s 10.244.2.47 kube-worker-1 <none> <none>The cluster is now in a deliberately uncomfortable state. kube-worker-1 is mostly full. kube-worker-2 is similarly loaded. kube-worker-3 is empty but tainted. Then we apply a critical pod that asks for the same eight CPU, with priority 1,000,000, and no taint toleration.
$ kubectl apply -f payments-high-prio.yaml
pod/payments-critical created
The first scheduling cycle has nothing to give it. Three nodes are insufficient, the fourth has the wrong taint. The scheduler turns to PostFilter, which walks each node looking for a preemption victim. The tainted node is no help. The non-tainted nodes each have a candidate to evict. The scheduler picks one, sets nominatedNodeName, and gracefully evicts the lower-priority nginx pod.
$ kubectl describe pod payments-critical | tail -14
QoS Class:        Guaranteed
Priority:         1000000
Priority Class:   high-priority-payments
Events:
  Type     Reason            Age   From               Message
  ----     ------            ----  ----               -------
  Warning  FailedScheduling  14s   default-scheduler  0/4 nodes are available: 3 Insufficient cpu, 1 node(s) had untolerated taint {workload: gpu}. preemption: 0/4 nodes are available: 1 Preemption is not helpful for scheduling, 3 No preemption victims found for incoming pod.
  Normal   Preempted         9s    default-scheduler  Preempted by default/nginx-demo on node kube-worker-1
  Warning  FailedScheduling  9s    default-scheduler  0/4 nodes are available: 3 Insufficient cpu. preemption: 0/4 nodes are available.
  Normal   Scheduled         4s    default-scheduler  Successfully assigned default/payments-critical to kube-worker-1
  Normal   Pulling           3s    kubelet            Pulling image "payments:v2.4.1"
  Normal   Pulled            1s    kubelet            Successfully pulled image "payments:v2.4.1" in 1.632s
  Normal   Created           1s    kubelet            Created container: payments
  Normal   Started           1s    kubelet            Started container payments
Read those events carefully. There is a FailedScheduling at 14s, then Preempted by default/nginx-demo on node kube-worker-1 at 9s, then another FailedScheduling (the cycle right after preemption, where the nginx pod was still terminating), then Scheduled at 4s. From request to running, on a real cluster, about ten seconds. That includes the graceful eviction of the victim, which is the slow part.
$ kubectl get pods -o wide
NAME                READY   STATUS    RESTARTS   AGE   IP           NODE            NOMINATED NODE   READINESS GATES
payments-critical   1/1     Running   0          22s   10.244.2.58  kube-worker-1   <none>           <none>
That is preemption working as designed. A higher-priority pod arrives, the scheduler refuses to leave it pending when there is a lower-priority pod that could be moved, and the cluster reshuffles. No human intervention. No alert at 3 a.m.
Three takeaways #
If only three things from this post stick with you:
1. The scheduler is plugins all the way down. Since 1.19, every meaningful decision is delegated to a plugin at one of thirteen extension points. You can write your own, disable the defaults, run multiple profiles in parallel. Volcano, Kueue, and Coscheduling exist because of this design. they did not have to fork the scheduler.
2. Filter is binary; Score is weighted. A single Unschedulable verdict from any of fourteen Filter plugins kills a node's candidacy. But Score is a weighted vote across nine plugins, and the weights are not equal. TaintToleration (×3) is the strongest single signal at scoring time, followed by the four ×2 plugins (NodeAffinity, PodTopologySpread, InterPodAffinity, DynamicResources). Weights matter much more than most engineers realize.
3. Reserve is why your scheduling is consistent. When you scale a deployment from one to twenty replicas and they all hit the scheduling queue in the same one-second window, Reserve's in-memory subtraction is what stops them from piling onto the same node. The scheduler commits an opinion before the API server even confirms the bind, and that opinion is visible to the next pod's scheduling cycle immediately.
Where to go from here #
The full scheduler walkthrough on YouTube has the live demo, every stage animated, the preemption flow shown end-to-end. Link is at the top of this post.
If you want to step through it yourself rather than watch, the interactive at https://kubernetes-explained.vercel.app/scheduler walks every internal step with annotations and lets you pause anywhere.
Sources for every claim in this post:
-
pkg/scheduler/apis/config/testing/defaults/defaults.go: plugin lists and weights -
pkg/scheduler/framework/plugins/: individual plugin implementations -
pkg/scheduler/backend/queue/scheduling_queue.go: the three queues -
pkg/scheduler/framework/plugins/defaultpreemption/default_preemption.go: the preemption algorithm -
KEP-624. the scheduling framework graduation history
-
The
kubectl describe podevents shown in the demo above are verbatim from a real Kubernetes 1.36.1 cluster, captured for this post.
Saiyam is working as Head of DevRel at vCluster Labs. He is the founder of Kubesimplify, focusing on simplifying cloud-native & AI infrastructure. He is KubeCon Co-chair and has worked on many facets of Kubernetes, including machine learning platforms, scaling, multi-cloud, & managed Kubernetes services. When not coding, Saiyam contributes to the community by writing blogs and organizing local meetups for Kubernetes and CNCF. He is also a CNCF TAG OpsRes Chair & can be reached on Twitter @saiyampathak.
Get new posts in your inbox.
Spotted a typo or want to improve this post? Edit on GitHub →